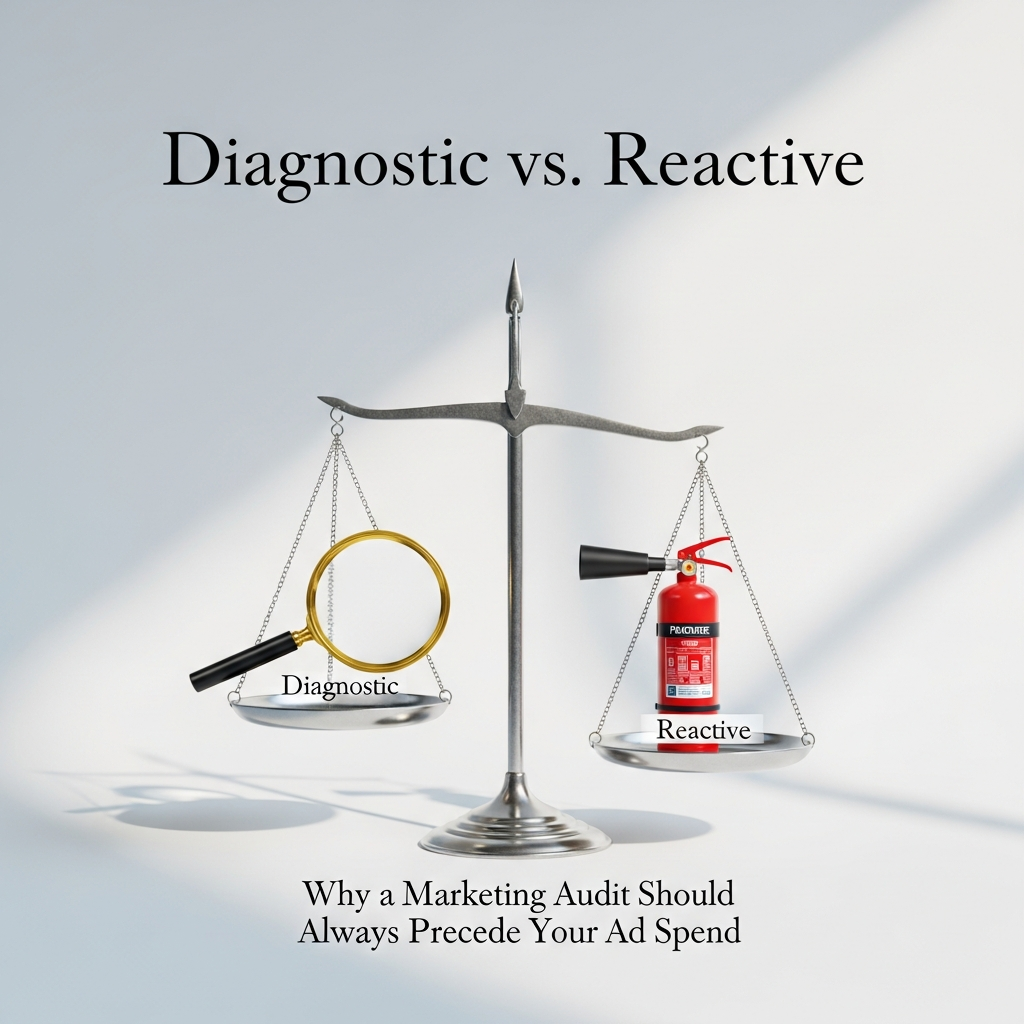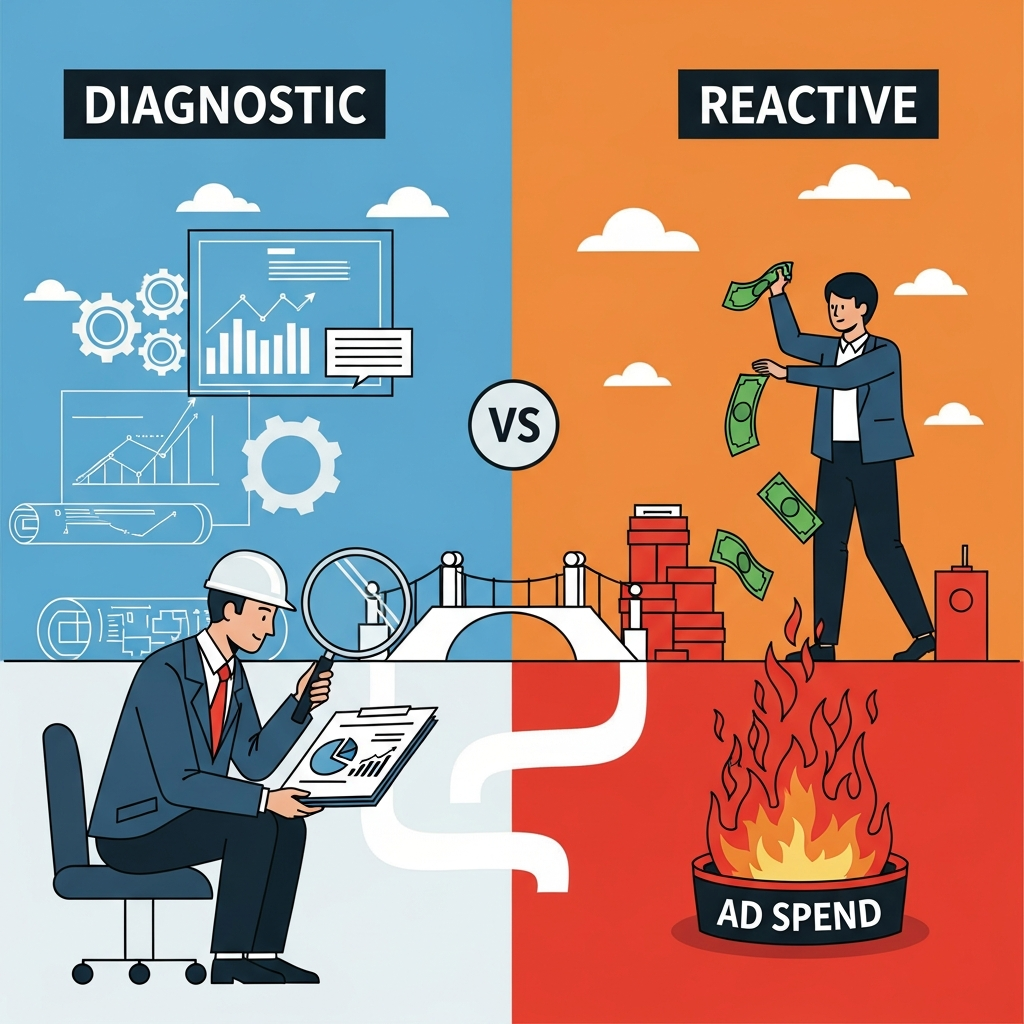
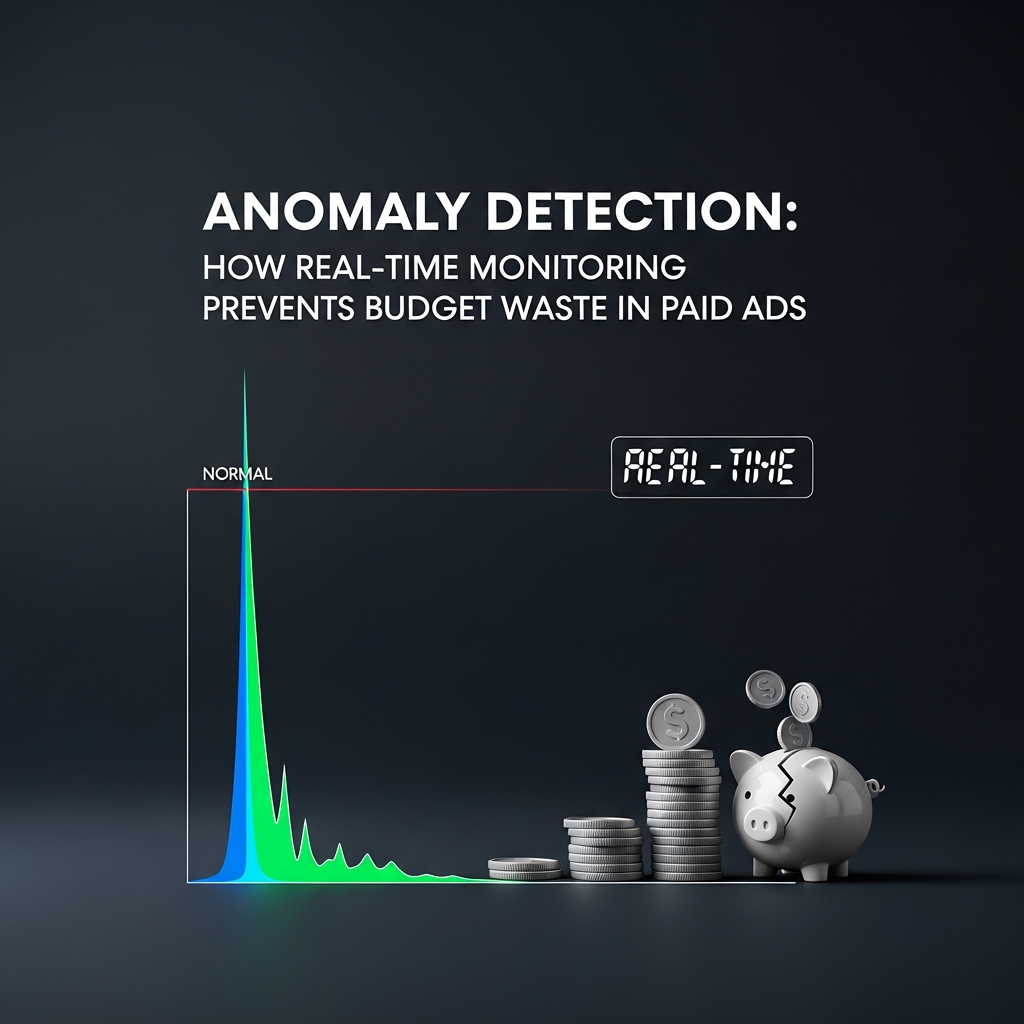
Anomaly Detection: How Real-Time Monitoring Prevents Budget Waste in Paid Ads.

In the high-stakes, hyper-kinetic arena of digital performance marketing, budget is the lifeblood, and efficiency is the pulse. Yet, for many enterprise-level advertisers, that pulse is often erratic, suffering from silent arrhythmias that bleed thousands of dollars before a human analyst even finishes their first espresso. We are living in an era where “setting and forgetting” a Google Ads or Meta campaign is less of a strategy and more of a financial suicide pact. Enter the silent sentinel: real-time anomaly detection.

The premise is deceptively simple: identifying patterns in data that do not conform to expected behavior. However, the execution is a masterclass in statistical sophistication. In the context of paid media, anomaly detection isn’t just about spotting a sudden spike in spend; it’s about the surgical identification of bot-driven click surges, broken conversion tracking, seasonal deviations, and the dreaded “fat-finger” manual entry error. This guide explores the analytical frameworks and technical architectures required to transmute raw ad data into a fortress of fiscal responsibility.
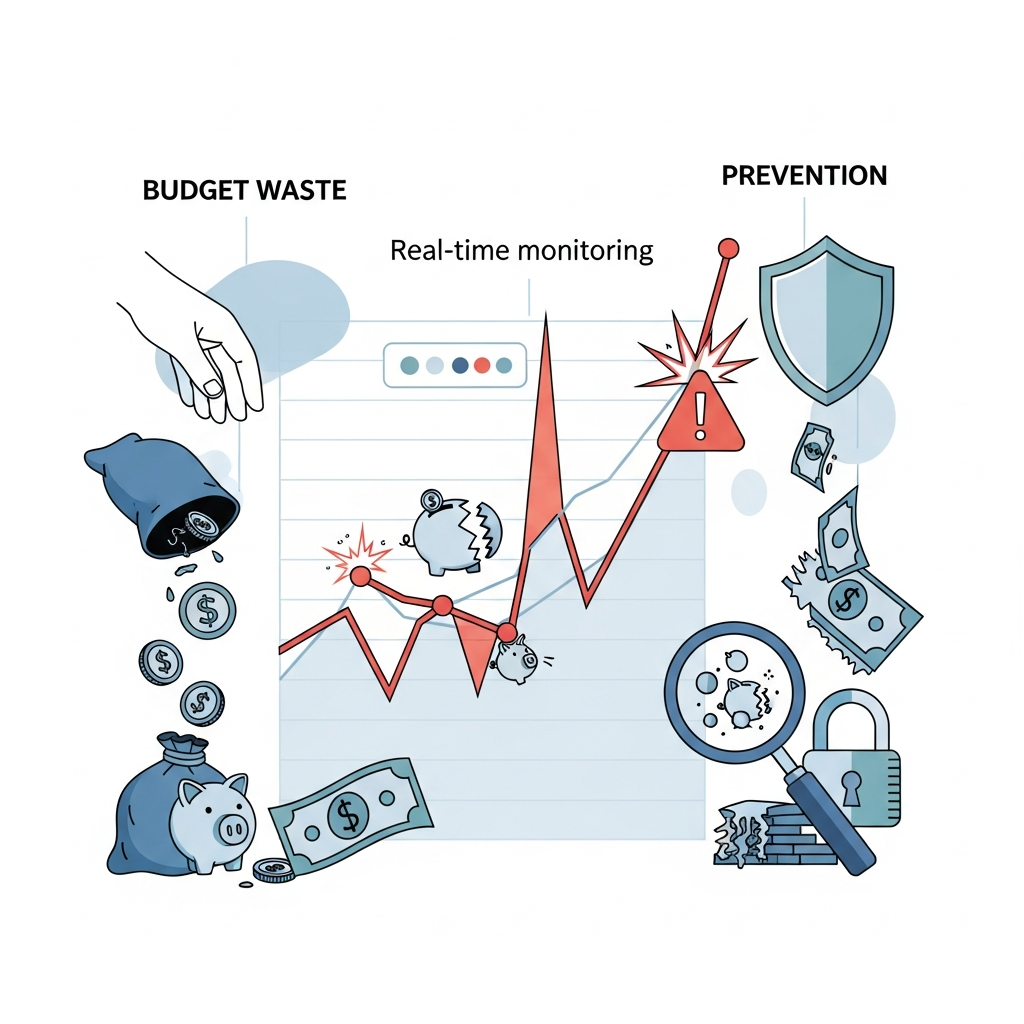
Visual for Anomaly Detection: How Real-Time Monitoring Prevents Budget Waste in Paid Ads.

The Anatomy of an Ad-Tech Catastrophe

To understand the “why” of anomaly detection, one must first confront the “how” of budget waste. Digital advertising is a fragmented ecosystem, prone to entropy. Waste typically manifests in three distinct flavors, each more insidious than the last.

1. Sophisticated Invalid Traffic (SIVT)

Unlike General Invalid Traffic (GIVT)—which includes basic search engine crawlers—SIVT is designed to mimic human behavior. We are talking about sophisticated botnets that move cursors, pause to “read” content, and even complete lead forms with stolen PII (Personally Identifiable Information). Without real-time monitoring, your Cost Per Acquisition (CPA) might look phenomenal while your actual sales pipeline remains a barren wasteland.

2. The “Broken Pipe” Syndrome

Tracking pixels are fragile. A minor update to a website’s Header Tag Manager or a shift in cookie consent strings can instantly sever the link between an ad click and a conversion. When the algorithm loses its feedback loop, it begins to “hallucinate,” often over-bidding on low-quality traffic because it can no longer distinguish between a bounce and a buy. Real-time detection flags the divergence between click volume and conversion signals within minutes, not days.

3. Algorithmic Runaway

Modern bidding strategies like Target ROAS (Return on Ad Spend) or Maximize Conversions are black boxes. Occasionally, a statistical outlier—perhaps a single high-value purchase from an unrepresentative user—can skew the algorithm’s perception of reality. It may then aggressively pursue similar (yet ultimately non-converting) profiles, burning through the monthly budget in a frantic, misguided quest for more outliers.

Visual for Anomaly Detection: How Real-Time Monitoring Prevents Budget Waste in Paid Ads.

The Mathematical Framework: Moving Beyond Simple Thresholds

If you are still relying on static alerts—such as “Notify me if spend increases by 20%”—you are bringing a knife to a quantum physics fight. Static thresholds are the enemies of nuance. They ignore seasonality, day-parting trends, and the inherent volatility of the auction environment. True anomaly detection leverages advanced statistical modeling to create a dynamic “envelope” of expected behavior.

“The difference between a trend and an anomaly is often found in the residuals of a time-series decomposition. If the noise starts singing a melody, you’ve got a problem.”

Bayesian Structural Time Series (BSTS)

BSTS models are particularly adept at handling the “marketing mix” problem. By decomposing a time series into trend, seasonality, and regression components, these models can predict what a metric *should* look like in the absence of an intervention. When the actual data deviates significantly from this counterfactual prediction, an anomaly is triggered. This is particularly useful for distinguishing between a legitimate holiday surge and a bot-induced spike.

The Isolation Forest Algorithm

Borrowing from the world of cybersecurity, the Isolation Forest is an unsupervised learning algorithm that identifies anomalies by isolating observations in a data set. Because anomalies are “few and different,” they are easier to isolate than normal points. In a high-dimensional space where you are tracking CVR, CTR, CPC, and Impression Share simultaneously, the Isolation Forest can detect multidimensional shifts that would be invisible to a human looking at a flat spreadsheet.

Z-Score and Standard Deviation

For those just beginning their journey, the Z-score remains a foundational tool. By calculating how many standard deviations a data point is from the mean, you can quantify “weirdness.” However, in the context of paid ads, a “Rolling Z-Score” is required to account for the fact that your “normal” mean is constantly evolving as the market fluctuates.

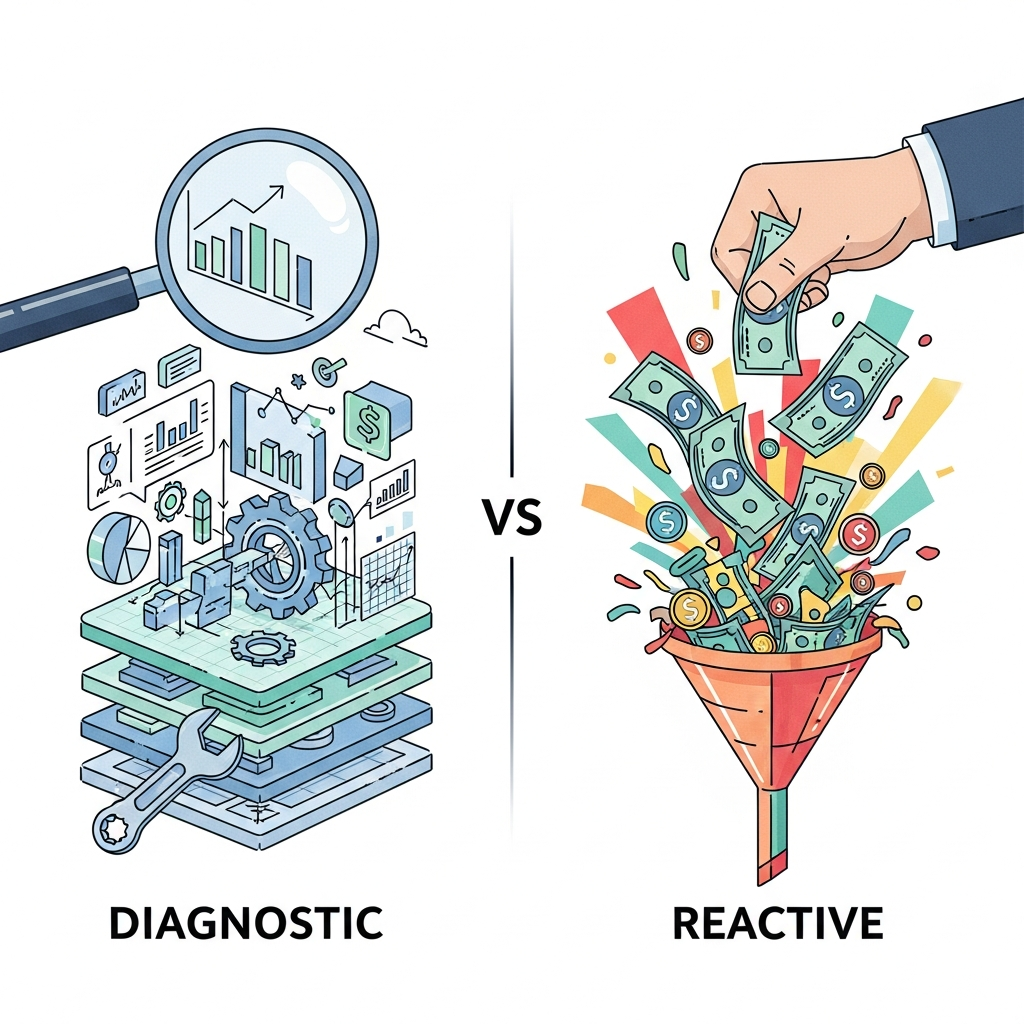
>Real-Time vs. Reactive: The Cost of Latency

In the world of high-frequency trading, milliseconds equal millions. Paid advertising is increasingly mirroring this reality. Most native platforms provide data with a 3-hour to 24-hour latency. Relying solely on the Google Ads UI to catch a budget bleed is like trying to put out a house fire with a report that arrived in the mail the next day.

Real-time monitoring requires an independent data pipeline. By hooking into APIs (Application Programming Interfaces) and streaming data into a centralized warehouse (like BigQuery or Snowflake), advertisers can run custom scripts every 15 minutes. This reduces the “Mean Time to Detection” (MTTD) from half a day to a quarter of an hour. The ROI here isn’t just about saving the wasted spend; it’s about the opportunity cost of the reclaimed budget.

  • Immediate Automated Pausing: If spend velocity exceeds 500% of the hourly norm, scripts can automatically pause the campaign, pending human review.
  • Negative Keyword Injection: Real-time detection can identify a surge in irrelevant search queries and add them as negatives before the next 10,000 impressions are served.
  • Bid Capping: During periods of unexplained CPC inflation, an automated system can enforce a temporary bid cap to protect the margin.

>The Human Element: Dealing with “False Positives”

One cannot discuss anomaly detection without addressing the boy who cried wolf. An overly sensitive system will bombard your Slack channels with alerts every time a celebrity mentions a related keyword on Twitter or a competitor goes dark. This leads to “alert fatigue,” where practitioners start ignoring the very system designed to protect them.

To mitigate this, sophisticated systems employ a Human-in-the-Loop (HITL) feedback mechanism. When an anomaly is flagged, the analyst shouldn’t just “resolve” it; they should categorize it. Was it a “True Positive” (actual fraud/error) or a “False Positive” (explainable market shift)? This feedback is fed back into the machine learning model to refine the “expected behavior” envelope, making the system more resilient and intelligent over time.

>Implementing Anomaly Detection: A Step-by-Step Blueprint

For the elite marketer, implementation is a three-tier process. It requires a synergy of engineering prowess, statistical rigor, and domain expertise.

Phase 1: Data Aggregation and Normalization

The first hurdle is the “silo” problem. Your Google Ads data doesn’t talk to your Shopify backend, and your Meta Ads data is off in its own walled garden. You must centralize this data. Use an ETL (Extract, Transform, Load) tool to pull raw, hourly data into a cloud environment. Crucially, ensure your data is normalized—adjusting for time zones and currency fluctuations—so that you are comparing apples to apples.

Phase 2: Defining the “Baseline of Sanity”

Don’t try to track everything at once. Start with the “Golden Metrics”:

  • Spend Velocity: The rate of budget consumption per hour.
  • Conversion Lag: The delta between a click and a recorded conversion.
  • CPC Volatility: Unexplained jumps in the cost of an auction.
  • CTR Anomalies: Unexpectedly high click-through rates that suggest bot manipulation.

Phase 3: Automation and Remediation

An alert is only as good as the action it triggers. Use tools like Python (with libraries such as Pandas and Prophet) to run your detection scripts. Connect these scripts to your communication stack (Slack, PagerDuty, or Email) and, ideally, back into the Ad Platform APIs to execute changes automatically.

>Case Study: The $50,000 “Fat Finger” Saved by a Script

Consider a global B2B SaaS company that recently expanded into the EMEA market. A junior account manager, while adjusting bids for a specific campaign, accidentally set the “Daily Budget” to what was intended to be the “Total Monthly Budget.” In the high-volume environment of broad-match keywords, Google’s systems were more than happy to oblige this sudden generosity.

Without anomaly detection, this error would have gone unnoticed until the finance department reconciled the credit card statement 30 days later. However, the company’s real-time monitoring script—running on a 30-minute interval—detected a spend velocity that was 1,200% above the rolling 7-day average. The script triggered an emergency “Pause All” command and sent a high-priority alert to the team’s Slack. Total time from error to resolution: 42 minutes. Total waste: $450. Potential waste: $50,000.

>Future Horizons: Predictive Anomaly Detection

We are currently transitioning from reactive detection to predictive prevention. The next generation of anomaly detection tools will use Generative AI and Large Language Models (LLMs) to not only identify a spike but also provide an instant linguistic analysis of the “why.” Imagine receiving a notification that says: “Spend is up 40% because of a surge in ‘competitor X’ brand terms; however, CVR is down 10% because your landing page is returning a 404 error in the Berlin region.”

Furthermore, we are seeing the rise of Ad-Exchange Forensics. By analyzing the packet-level data of ad requests, real-time systems can identify the digital fingerprints of known botnets before the bid is even placed. This shifts the strategy from “reclaiming wasted budget” to “never spending it in the first place.”

>Conclusion: The Vigilance Dividend

In the digital age, waste is not an inevitability; it is a choice. Every dollar lost to a bot, a broken pixel, or a manual error is a dollar that could have been used to reach a genuine customer, test a new creative, or expand into a new market. Anomaly detection is the technological manifestation of the “Vigilance Dividend”—the competitive advantage gained by those who refuse to let their budgets bleed out in the dark.

As the complexity of the ad-tech ecosystem continues to scale, the human eye will become increasingly inadequate as a primary defense. Embracing the analytical rigor of real-time monitoring is no longer a luxury for the data-obsessed; it is a fundamental requirement for the fiscally responsible. The question is no longer whether you can afford to implement anomaly detection, but whether you can afford the catastrophic cost of its absence.

Are you watching your metrics, or is your budget watching you?

The Multi-Channel Attribution Myth: Tracking the True Path to Purchase in 2026

For decades, digital marketing has been haunted by a ghost. Not the spectral, chain-rattling variety, but a far more insidious poltergeist: the phantom of the “perfectly tracked” customer journey. We have collectively hallucinated a world where a user sees a Facebook ad, clicks a Google search link, reads a blog post, and then—with the surgical precision of a Swiss watchmaker—converts, leaving behind a pristine trail of digital breadcrumbs. We called it Multi-Channel Attribution (MCA), and we treated its dashboards as if they were carved into stone tablets brought down from Mount Sinai.

But as we navigate the landscape of 2026, the mirage has finally evaporated. The industry is waking up to a sobering reality: Multi-channel attribution was never a map of the territory; it was a comforting fiction we told ourselves to justify bloated ad spends to skeptical CFOs. Between the final sunset of third-party cookies, the aggressive fortification of “walled gardens,” and the rise of AI-driven search agents, the “Path to Purchase” has become less of a straight line and more of a quantum superposition. To track it, we must abandon our old tools and embrace a new, far more complex methodology of triangulation and inference.

Visual for The Multi-Channel Attribution Myth: Tracking the True Path to Purchase in 2026

The Deceptive Comfort of Linear Models

Historically, attribution was a game of oversimplification. We clung to models like First-Touch, Last-Touch, or Linear Distribution because they were computationally inexpensive and emotionally satisfying. If a customer bought a high-end espresso machine after clicking an email, the email team got the champagne. Never mind that the customer had been subconsciously primed by six months of YouTube reviews, three podcast mentions, and a chance encounter with the brand at a local trade show.

These models suffer from what economists call the narrative fallacy—our tendency to turn a sequence of random events into a coherent story of cause and effect. In 2026, this fallacy is no longer just a minor accounting error; it is a strategic liability. When you attribute 100% of a sale to the last click, you aren’t just misallocating credit; you are systematically defunding the top-of-funnel awareness that made the last click possible in the first place. It is the marketing equivalent of a striker in soccer taking all the credit for a goal, despite the midfield having spent ninety minutes orchestrating the play.

The Incrementalism Trap

The greatest casualty of traditional attribution is the understanding of incrementality. In the mid-2020s, many brands discovered—painfully—that a significant portion of their “attributed” revenue was actually “organic cannibalization.” They were paying Google and Meta to show ads to people who were already going to buy. This “Attribution Industrial Complex” flourished by claiming credit for the inevitable. In 2026, the elite marketer focuses not on what the dashboard says, but on what would have happened if the ad spend had been zero. If your ROAS (Return on Ad Spend) looks too good to be true, it likely is; you are probably just tax-collecting on your own brand equity.

Visual for The Multi-Channel Attribution Myth: Tracking the True Path to Purchase in 2026

The Privacy Panopticon and the Death of Determinism

We are currently living through the “Post-Deterministic Era.” The era of “stitching” identities across devices and platforms is effectively over. Apple’s App Tracking Transparency (ATT) was merely the opening salvo in a war that has now seen the total lockdown of MAC addresses, the obfuscation of IP addresses via private relays, and the implementation of heavy-handed data residency laws globally.

The technical hurdles are now insurmountable for traditional tracking:

  • The Decay of the Signal: Browsers now treat tracking scripts with the same hostility they once reserved for malware. Even first-party cookies have shortened lifespans, making “Long-Term Attribution” a literal impossibility for products with high consideration cycles.
  • Walled Garden Isolation: Google, Meta, and Amazon have built taller walls. They will tell you what happened inside their ecosystem with granular detail, but the moment the user steps outside, the trail goes cold. We are left with “Data Silos” that refuse to speak the same language.
  • AI Agent Intermediation: In 2026, a significant portion of the “search” process is performed by AI agents—Large Language Models (LLMs) that browse the web on behalf of the user. When a user asks an AI to “find me the best noise-canceling headphones for under $300,” the AI parses the web, synthesizes the data, and presents a recommendation. The brand never sees the user; they only see the bot. How do you attribute a sale when the “buyer” was a piece of software?

“Attribution in 2026 is no longer about following the user; it is about modeling the aggregate behavior of the crowd. We have moved from the microscope to the telescope.”

>Enter the Renaissance of Marketing Mix Modeling (MMM)

As deterministic tracking died, a relic from the 1960s was resurrected and supercharged with machine learning: Marketing Mix Modeling. Unlike traditional attribution, which tries to track individual users, MMM uses high-level statistical analysis to determine how different inputs (spend across various channels) correlate with outputs (sales).

The beauty of modern MMM in 2026 is its resilience to privacy shifts. It doesn’t need to know who bought the product; it only needs to know that when we increased spend on TikTok by 20% in the Pacific Northwest, total sales rose by 4% after a three-week lag. This is Top-Down Attribution, and it is the only way to account for the “untrackable” channels: television, out-of-home (OOH), word-of-mouth, and the increasingly influential world of “Dark Social.”

The Rise of Dark Social

Dark Social refers to the vast amount of social sharing that happens in private channels—Slack, WhatsApp, Discord, and Telegram. When a colleague drops a link to a SaaS tool in a private Slack channel, and the CTO buys it three days later, the analytics platform sees that as “Direct/None.” This is a massive blind spot. Our research suggests that for B2B enterprises, up to 70% of the “influence” happens in spaces where trackers cannot go. To solve this, 2026 marketers are utilizing “Self-Reported Attribution” (SRA). A simple, open-ended question at checkout—”How did you first hear about us?”—often yields more accurate data than a million-dollar tech stack.

>The Triangulation Strategy: A New Framework

Since no single source of truth exists, the elite human marketer in 2026 uses a Triangulation Framework. This involves balancing three distinct data streams to find the “center of gravity” for their marketing efficacy.

1. Platform-Specific Data (The Micro View)

While biased, the data provided by Meta or Google is still useful for intra-channel optimization. It tells you which creative is working within that specific environment. However, it should never be used to decide inter-channel budget allocation. Use platform data to win the battle, but don’t use it to plan the war.

2. Marketing Mix Modeling (The Macro View)

Deploying Bayesian regression models to understand the long-term impact of brand building versus performance marketing. This allows for the calculation of “Carryover Effects”—the reality that an ad seen today might not result in a sale for six months. MMM is the “truth serum” for your marketing budget.

3. Incrementality Testing (The Scientific View)

This is the gold standard. By running “Lift Studies”—where a specific region or audience is intentionally withheld from seeing ads (the control group)—marketers can measure the true incremental value of their spend. If the group that didn’t see the ads bought the product at the same rate as the group that did, your marketing isn’t driving growth; it’s just subsidizing existing demand.

>Psychographic Nuance: Why Humans Buy (and Why Data Misses It)

The obsession with technical attribution often blinds us to the psychological reality of the purchase path. Consumption is rarely a logical progression. It is a messy, emotional, and often impulsive reaction to a multitude of stimuli. A consumer might be influenced by a brand’s stance on sustainability (untrackable), a recommendation from a trusted influencer on a locked Instagram story (untrackable), and a sense of nostalgia triggered by a specific color palette (untrackable).

In 2026, the most successful brands are those that stop trying to “game” the attribution algorithm and start focusing on “Brand Salience.” If you are the first brand that comes to mind when a need arises, attribution doesn’t matter. You have already won. The “Path to Purchase” is increasingly moving inside the consumer’s mind, a place where no cookie or tracking pixel can ever hope to reside.

The Role of Zero-Party Data

To bridge the gap, we are seeing a pivot toward Zero-Party Data—information that a customer intentionally and proactively shares with a brand. This includes preference centers, interactive quizzes, and community engagement. By incentivizing users to tell us about their journey, we bypass the need for invasive tracking. It turns out that if you provide enough value, people will actually tell you why they are buying from you. What a concept.

>The Infrastructure of 2026: Probabilistic over Deterministic

If you are still building your 2026 strategy on deterministic foundations, you are building on quicksand. The transition to probabilistic modeling is mandatory. This involves using machine learning to fill in the gaps where data is missing. For instance, if we know that 40% of our mobile web users are on iOS devices with high privacy settings, we can use the behavior of the “visible” 60% to model the likely behavior of the “invisible” 40%.

This requires a cultural shift within marketing departments. We have to become comfortable with confidence intervals rather than absolute integers. A report might no longer say “We made $1,402,301 from this campaign.” Instead, it will say “We are 95% confident that this campaign generated between $1.2M and $1.6M in incremental revenue.” To the uninitiated, this looks like guesswork. To the expert, it is the only honest way to report data in a fragmented world.

>Conclusion: Embracing the Mess

The “Multi-Channel Attribution Myth” was born out of a desire for control in an uncontrollable world. We wanted to believe that the human psyche was a predictable machine that we could program with enough ad impressions. 2026 has stripped away that illusion, revealing a landscape that is chaotic, private, and deeply human.

The marketers who will thrive in this era are not those with the most complex tracking scripts, but those who understand that influence is not an event, but an atmosphere. By combining the macro-insights of MMM, the scientific rigor of incrementality testing, and the humble honesty of customer surveys, we can finally stop chasing the ghost of the “perfect path” and start building brands that people actually want to find—regardless of how they get there.

The path to purchase isn’t a trackable sequence of clicks; it’s a series of emotional resonances. In 2026, the best way to “track” your customers is to lead them so effectively that the tracking becomes an afterthought. The myth is dead. Long live the nuance.

Competitive Displacement: A Scientific Approach to Outranking Established Market Leaders

In the high-stakes theater of modern commerce, the “incumbent” is often viewed as an immovable geological formation. They possess the brand equity, the sprawling distribution networks, and the war chests that make venture capitalists salivate. Yet, if the history of industry teaches us anything, it is that the largest trees in the forest often create the very shadows that nurture their eventual replacements. Competitive displacement is not a matter of sheer force; it is a clinical, almost surgical application of strategic asymmetry. It is the science of finding the precise point where an established leader’s greatest strength becomes their most catastrophic liability.

To the uninitiated, unseating a market leader looks like a chaotic brawl. To the elite strategist, it is a study in Gause’s Principle of Competitive Exclusion: two species competing for the exact same resource cannot coexist at constant population values. One will eventually gain even the slightest advantage over the other, leading to the extinction or displacement of the second. In business, this “slight advantage” is rarely a cheaper price point—it is a superior alignment with the evolving reality of the user.

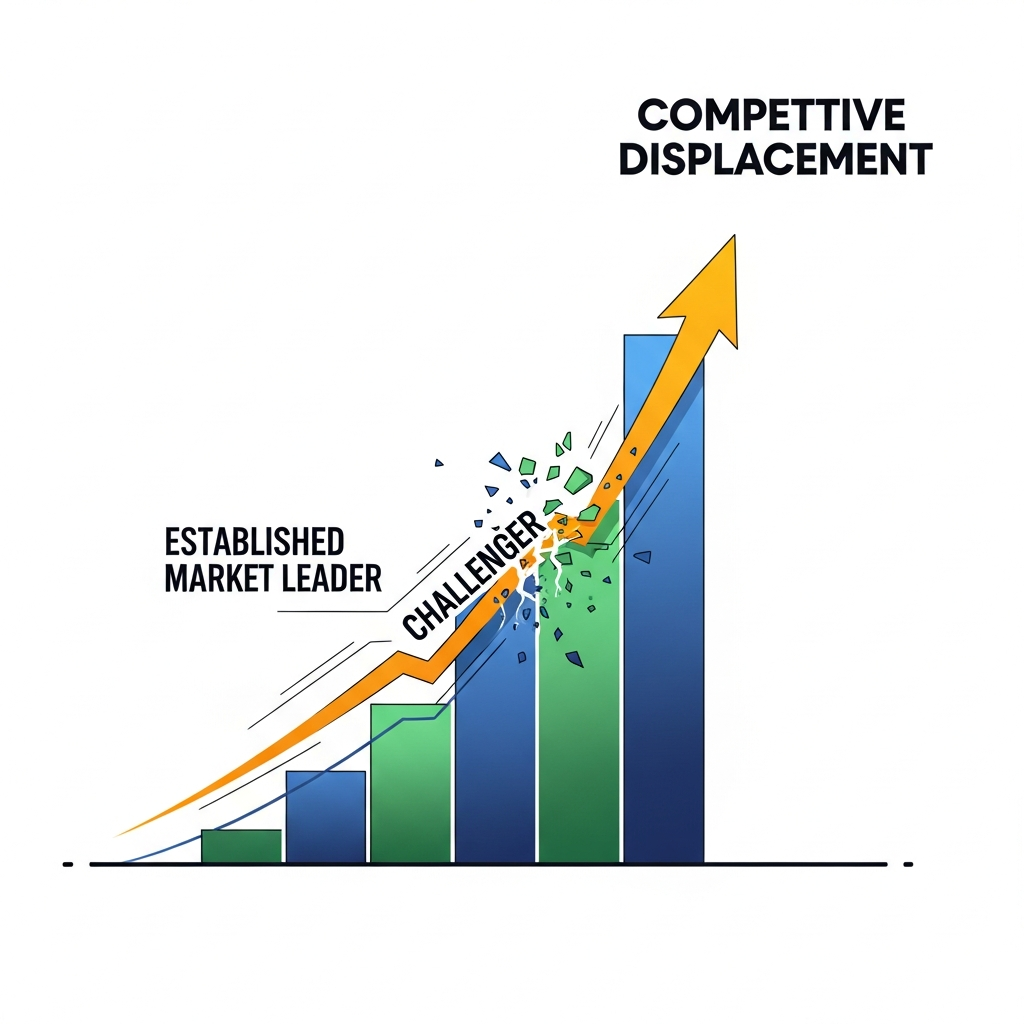
Visual for Competitive Displacement: A Scientific Approach to Outranking Established Market Leaders

The Entropy of Giants: Why Market Leaders Are Structurally Vulnerable

Before we discuss the “how” of displacement, we must understand the “why” of incumbent decay. Large organizations suffer from what I call Organizational Ossification. As a company scales, its primary objective shifts from “solving a problem” to “preserving the solution.” This subtle transition is the beginning of the end. Their processes become rigid, their risk tolerance evaporates, and their product roadmap begins to resemble a Frankenstein’s monster of legacy features and technical debt.

Consider the incumbent’s dilemma: they cannot innovate too radically because they risk alienating their existing, high-paying enterprise base. They are trapped in a golden cage of their own making. This creates a “Product-Market Gap” where the actual needs of the market have moved forward, but the incumbent’s product remains tethered to a previous era’s requirements. This gap is your entry point.

The Psychology of the Status Quo Bias

Displacement is as much a psychological battle as a technological one. Humans are biologically wired to prefer the “devil they know.” This is the Status Quo Bias, a cognitive preference for the current state of affairs. To displace a leader, your offering cannot merely be “better.” It must be so significantly superior that it overcomes the neurological friction of change. Research suggests that for a user to switch, the perceived value of the new solution must be at least 2.5 to 3 times greater than the current one to offset the perceived risk of abandonment.

“The incumbent’s greatest defense is not their feature set, but the collective exhaustion of their users. Your job is to provide the adrenaline shot.”

Visual for Competitive Displacement: A Scientific Approach to Outranking Established Market Leaders

Phase I: Diagnostic Intelligence and Sentiment Mining

A scientific approach to displacement begins with data, not intuition. You must perform a heuristic evaluation of the incumbent’s ecosystem. Where are they failing? The answer is rarely in their marketing copy; it is buried in the “one-star” reviews, the Reddit threads of disgruntled power users, and the support tickets that remain open for months.

Sentiment Mining involves using Natural Language Processing (NLP) to categorize the specific “pain clusters” of an incumbent’s audience. Are they complaining about the UI? The lack of integration? The predatory pricing? By mapping these clusters, you aren’t just building a product; you are building an antidote. You are looking for Negative Network Effects—points where the incumbent’s size actually makes the product worse for the individual user (e.g., slow load times, bureaucratic support, bloated interfaces).

The Feature Parity Trap

One of the most common mistakes in competitive displacement is the pursuit of feature parity. Startups often think, “If we have everything they have plus one more thing, we win.” This is a fallacy. Feature parity leads to “me-too” products that lack a distinct identity. Instead, focus on Feature Salience. Identify the 20% of features that drive 80% of the value and make them flawlessly intuitive. Then, aggressively ignore the legacy bloat that the incumbent is forced to maintain.

>Phase II: Strategic Asymmetry and the 10x Value Proposition

Once the diagnosis is complete, you must apply the principle of Strategic Asymmetry. This is the art of competing in a way that the incumbent cannot easily replicate without destroying their own business model. If the incumbent relies on high-touch sales and annual contracts, your asymmetry might be a friction-less, product-led growth (PLG) model with monthly billing. If they are a “closed garden,” you become the open, “API-first” alternative.

The “Point of Entry” Strategy

Do not attack the incumbent’s entire kingdom at once. Instead, identify a High-Value Wedge. This is a specific niche or use case that the incumbent has neglected or over-served. By dominating this specific sub-segment, you establish a beachhead. From there, you can expand your footprint through Adjacent Market Penetration. This was the strategy used by Zoom. They didn’t try to be “the enterprise communication suite” like Cisco Webex; they simply tried to be the “video call that actually works.” Once they owned the call, they owned the meeting room, and eventually, the entire communication stack.

  • Identifying the Wedge: Look for the “Over-served” customer who is paying for 100 features but only needs 5.
  • Optimizing the Friction: Reduce the “Time to Value” (TTV) to under five minutes.
  • Radical Transparency: Use the incumbent’s lack of transparency (hidden pricing, complex SLAs) as a marketing weapon.

>Phase III: Reducing the Friction Coefficient (The Migration Engine)

The greatest barrier to displacement is the “Switching Cost.” This includes the financial cost, the time cost of retraining staff, and the emotional cost of potential failure. To displace an established leader, you must engineer a Frictionless Migration Engine.

This is where the “Science” part of the approach becomes literal. You need to treat the migration as a technical hurdle to be automated. Build one-click importers. Create “Shadow Mode” environments where the user can see your product working with their real data before they ever cancel their old subscription. If you can make the transition invisible, you’ve won the battle of inertia.

The “Aha! Moment” vs. The “Oh, No” Moment

In the first 30 days of displacement, you are in a race against buyer’s remorse. Every minor bug in your software will be magnified because the user is looking for a reason to go back to the “safety” of the incumbent. You must engineer multiple Micro-Wins—small, high-visibility successes that validate the user’s decision to switch. This is the “Aha! Moment” on steroids.

>SEO and Digital Dominance: Outranking the Goliath

In the digital realm, displacement is reflected in the Search Engine Results Pages (SERPs). An incumbent usually dominates high-volume, “Category” keywords. Trying to outrank them for “CRM Software” or “Project Management” is a war of attrition you likely cannot afford. Instead, you must use Semantic Encirclement.

Focus on “Comparison” and “Alternative” keywords. These are high-intent searches. When someone searches “[Incumbent Name] Alternatives,” they are literally telling the world they are ready to leave. Your content strategy should not be a “hit piece,” but a clinical comparison that acknowledges the incumbent’s strengths while highlighting the specific “Modern Use Cases” where they fail. This builds authority and trust.

The Power of Semantic Clusters

Google’s algorithms have evolved from simple keyword matching to understanding Topic Authority. To outrank a leader, you must build a deeper, more specialized knowledge graph around the “problems” the leader solves, rather than the “product” itself. If you are displacing a legacy accounting software, don’t just write about accounting; write about “Automating R&D Tax Credit Compliance for SaaS Companies.” The specificity of your expertise is your competitive advantage.

>Phase IV: The Cultural Coup

Every long-standing market leader has a “Brand Mythos.” To displace them, you must provide a new, more compelling narrative. This is the transition from a “Tool” to a “Movement.” People don’t just buy Slack because it’s a chat app; they bought it because they were “Done with Email.” They didn’t buy Tesla because it was a car; they bought it because it was “The Future.”

Your marketing must position the incumbent as anachronistic. They aren’t “bad”; they are simply from a different era. Use language that emphasizes agility, modern workflows, and “the way people work now.” This creates a “Fear of Being Left Behind” (FOMO) among the incumbent’s user base. If staying with the leader makes the user feel like they are using a rotary phone in an iPhone world, the displacement is already complete.

The Feedback Loop: Staying the Disruptor

The most tragic part of the displacement cycle is when the disruptor becomes the disrupted. To avoid this, you must institutionalize the Disruptor’s Mindset. This means intentionally Cannibalizing your own features before someone else does. It means maintaining a “Day 1” culture (as Jeff Bezos famously advocated) where the customer’s evolving dissatisfaction is the primary driver of innovation, not the competitor’s roadmap.

>Summary of the Displacement Framework

To summarize the scientific approach to competitive displacement, one must follow a rigorous sequence of analytical and tactical steps:

  • Structural Analysis: Identify the incumbent’s “Legacy Weight”—technical debt, rigid pricing, and organizational inertia.
  • Sentiment Mining: Use NLP and deep social listening to find the specific “Pain Clusters” that the incumbent is ignoring.
  • Strategic Asymmetry: Build a business model that the incumbent cannot copy without harming their existing revenue streams.
  • Wedge Entry: Dominate a high-value niche rather than attacking the broad market.
  • Migration Automation: Reduce the “Friction Coefficient” to near-zero through automated importers and “Shadow Mode” trials.
  • Semantic SEO: Encircle the incumbent by owning high-intent “Alternative” and “Problem-Solution” keywords.
  • Narrative Shift: Frame the incumbent as anachronistic and your solution as the “Modern Standard.”

>Conclusion: The Relentless Pursuit of Entropy

Market leadership is not a permanent state; it is a temporary equilibrium. The very qualities that allow a company to achieve dominance—standardization, scale, and predictability—eventually become the anchors that prevent them from adapting to the next shift in the environment. Competitive displacement is not about “winning” a market; it is about recognizing that the market has already moved and being the first to build a home in the new reality.

Success in this arena requires a paradoxical blend of academic rigor and street-fighter aggression. You must analyze the data with the cold eye of a scientist, then execute your strategy with the wit and speed of a disruptor. The giants are not as stable as they appear. They are merely waiting for a competitor who understands the physics of their downfall better than they do. Go forth and be the catalyst of their entropy.

Predictive Algorithm Modeling: Anticipating Search Intent Before the Competition

In the halcyon days of search engine optimization, we were all essentially digital cartographers, mapping out the landscape of keywords that had already been settled. We looked at historical data, sighed over the monthly search volumes provided by tools that were—let’s be honest—little more than educated guesses, and optimized for the past. But the map is not the territory. Today, the landscape is shifting in real-time. If you are waiting for a keyword to show up in a SEMrush or Ahrefs dashboard with a “high volume” badge, you are already three months too late to the feast. The scraps that remain are hard-fought and expensive.

Welcome to the era of Predictive Algorithm Modeling. This isn’t just about anticipating the next trend; it’s about using stochastic modeling, time-series analysis, and deep learning to identify the latent intent of users before they even know they have it. It is the transition from being a reactive content creator to a proactive architect of digital demand. In this comprehensive guide, we will dissect the mechanics of predictive SEO, exploring how you can out-maneuver both the algorithm and your competition by living in the future.

Visual for Predictive Algorithm Modeling: Anticipating Search Intent Before the Competition

The Epistemology of Search: Moving Beyond the Keyword

To understand predictive modeling, one must first undergo a bit of an intellectual ego-death regarding keywords. Keywords are merely the linguistic residue of an underlying psychological state. When a user types a query, they are attempting to bridge the gap between a state of lack and a state of resolution. Traditional SEO focuses on the bridge; predictive modeling focuses on the tectonic shifts that create the gap in the first place.

Search engines like Google have moved from being lexical (matching words) to semantic (matching meaning) and are now becoming predictive (anticipating needs). Through the implementation of BERT, MUM (Multitask Unified Model), and subsequent iterations, Google’s neural networks are increasingly capable of understanding the “trajectories” of search behavior. If a user searches for “early signs of pregnancy,” the algorithm already knows the statistical likelihood of them searching for “best prenatal vitamins” in three days and “stroller reviews” in five months. Predictive modeling allows us to occupy those future spaces before the competitive noise becomes deafening.

“The best way to predict the future is to create it, but in the absence of omnipotence, the second-best way is to model the recurring patterns of human desire using high-velocity data streams.”

The Anatomy of a Predictive Search Model

Building a predictive model isn’t about gazing into a crystal ball; it’s about crunching the right variables. An elite predictive SEO framework typically involves three core layers:

  • Historical Seasonality: Not just “Christmas is in December,” but the micro-fluctuations of intent that occur in specific fiscal quarters or even weather patterns.
  • Correlative External Signals: Monitoring social sentiment, venture capital flow, and legislative shifts that act as leading indicators for search demand.
  • User Pathing Latency: Analyzing the time-to-conversion between informational queries and transactional queries within a specific niche.
Visual for Predictive Algorithm Modeling: Anticipating Search Intent Before the Competition

Data Ingestion: The Fuel for the Machine

A model is only as robust as the data that feeds it. Relying solely on Google Search Console is like trying to navigate the Atlantic with a bathtub toy. To anticipate intent, we need a “Data Lake” approach. This involves aggregating disparate data sources into a unified repository for analysis.

For an elite practitioner, this means using Python or R to scrape and integrate several streams. Consider the Google Trends API. While the web interface is rudimentary, the API allows for granular “interest over time” data that can be correlated with internal CRM data. If you notice that interest in “remote work infrastructure” peaks exactly 14 days after a specific type of economic report is released, you have a predictive window. You don’t wait for the peak; you publish 10 days after the report.

Furthermore, we must look at Social Listening and Sentiment Analysis. Platforms like Reddit and X (formerly Twitter) are the “canaries in the coal mine” for search intent. A spike in discussions regarding “AI-driven supply chain disruptions” on specialized subreddits will almost inevitably precede a surge in search queries for related B2B solutions. By using Natural Language Processing (NLP) to cluster these discussions, we can identify “emergent entities” before they enter the mainstream lexicon.

Feature Engineering for Intent Forecasting

In machine learning, feature engineering is the process of using domain knowledge to extract features from raw data. In our context, we are looking for “Intent Signals.” For example, if we are in the SaaS space, our features might include:

  • Rate of change in competitor mentions on G2 or Capterra.
  • The velocity of new GitHub repositories being created in a specific technology stack.
  • Macroeconomic indicators like interest rate hikes (which might trigger searches for “cost-saving software”).
Visual for Predictive Algorithm Modeling: Anticipating Search Intent Before the Competition

Algorithmic Architectures: Choosing Your Weapon

Once the data is cleaned and the features are engineered, we must choose a modeling approach. While many SEOs are content with a simple linear regression, the complexities of human search behavior often require more sophisticated “Non-linear” approaches.

1. Time-Series Analysis (Prophet and ARIMA)

For predicting seasonal peaks and cyclical trends, Facebook’s Prophet or the ARIMA (AutoRegressive Integrated Moving Average) model are industry standards. These models are particularly adept at handling outliers—such as the massive search anomalies caused by the 2020 pandemic—and smoothing them out to reveal the underlying trend. They allow you to say, with a high degree of confidence, “By June 15th, search intent for ‘sustainable swimwear’ will increase by 42% regardless of current weather patterns.”

2. Random Forests and XGBoost

If you are trying to predict categorical intent (i.e., whether a searcher will want “How-to” content vs. “Pricing” content), gradient-boosted decision trees like XGBoost are remarkably powerful. By feeding the model historical user journey data, you can predict the “Next Best Content” to serve a user. This is how high-level publishers dominate the SERPs; they don’t just rank for one query; they have modeled the entire decision-making tree and have content ready for every branch.

3. Recurrent Neural Networks (RNNs) and LSTMs

Human behavior is sequential. What I searched for yesterday influences what I search for today. Long Short-Term Memory (LSTM) networks are a type of RNN designed to recognize patterns in sequences. In the context of predictive SEO, LSTMs can be used to model the “decay” of interest. It can tell you when a topic is not just “down for the week” but is officially entering a state of permanent obsolescence, allowing you to reallocate your crawl budget and editorial resources to more fertile ground.

>The Psychology of the “Pre-Search” Phase

Before a user types a query into Google, they exist in a “Pre-Search” state of ambiguity. They have a problem, but they haven’t yet formulated the language to solve it. Predictive algorithm modeling seeks to own this state of ambiguity. If you can provide the answer before the user has even finished articulating the question, you don’t just win a click; you win authority.

This requires a deep dive into Psychographic Layering. Let’s say you are in the fintech space. A reactive SEO focuses on “how to invest in stocks.” A predictive SEO realizes that a certain segment of the population is currently worried about “inflationary pressure on mid-cap assets.” By the time those users start searching for specific investment vehicles, they should already be familiar with your brand because you predicted their anxiety and addressed it through “top-of-funnel” predictive content pieces weeks earlier.

“The most sophisticated algorithms don’t just follow the user; they anticipate the collision between necessity and curiosity.”

>Operationalizing Predictive SEO: A Practical Framework

Theory is fine for academic journals, but for the elite copywriter and strategist, we need a roadmap. How do we turn these complex data models into actual ranking content?

Step 1: The Inventory of Intent

Map your current content against the Standard Buyer’s Journey. However, add a “T-Minus” column. This column represents the predicted time before the user enters that stage. For a luxury travel brand, the “T-Minus 90 days” intent might be “dreaming/escapism,” while “T-Minus 30 days” is “logistical planning.” Your goal is to create a content bridge that leads them through these phases automatically.

Step 2: The “Shadow” Keyword Strategy

Identify keywords that do not yet have significant volume but are “semantically adjacent” to growing trends. Use Latent Dirichlet Allocation (LDA) to find topics that frequently co-occur in academic papers or patent filings in your industry. If you see a specific term being used in white papers, it is only a matter of time before it trickles down into consumer search intent. Build the pillar pages for these terms now. When the volume arrives, you will have the oldest, most authoritative URL on the subject.

Step 3: Real-Time Content Injection

Use a “Headless CMS” paired with your predictive model to dynamically update content. If your model predicts a sudden surge in interest for “remote work security” due to a news break, your homepage and sidebar “recommended reading” should update programmatically to surface that content. This isn’t just SEO; it’s User Experience Optimization powered by predictive analytics.

>The Risks: Overfitting and the Echo Chamber

As with any high-level strategy, there are pitfalls. The most common in predictive modeling is overfitting. This happens when your model is so finely tuned to historical data that it fails to account for “Black Swan” events. If your model only looks at last year’s trends, it will be blindsided by a sudden cultural shift or a new technological breakthrough (like the sudden explosion of Generative AI).

There is also the “Echo Chamber” effect. If every major player is using the same predictive models, we all end up producing the same “future-proof” content at the same time, leading to a new kind of competitive saturation. The solution is to inject human eccentricity into the model. Use your predictive data as the skeleton, but use human intuition, wit, and unique brand voice as the skin. An algorithm can predict what people will search for, but it cannot yet predict what will truly resonate with their souls.

>The Future: Autonomous SEO Agents

We are rapidly approaching a point where the “human-in-the-loop” will become the bottleneck. We are seeing the rise of Autonomous SEO Agents—AI systems that not only predict intent but automatically generate, publish, and iterate on content to meet that intent in real-time. This sounds like science fiction, but for those of us working with Large Language Models (LLMs) and Vector Databases, it is the current frontier.

In this future, the role of the elite copywriter evolves. We become the “Prompt Architects” and the “Strategic Overseers.” We manage the models, ensuring they don’t hallucinate or veer off-brand, while the predictive algorithms do the heavy lifting of trend spotting and intent mapping. The competitive advantage will go to those who can master the interplay between data science and narrative craft.

>Conclusion: The Proactive Advantage

Predictive algorithm modeling is more than a technical upgrade; it’s a fundamental shift in mindset. It’s moving from the “Ask and Receive” model of search to the “Anticipate and Provide” model. By the time your competitor is looking at a keyword report, you should already be ranking for those terms, with a backlink profile that is months in the making and content that has been refined through early user feedback.

The digital world doesn’t wait for the slow. It rewards those who can read the ripples in the water before the wave arrives. Stop optimizing for what was. Start modeling for what will be. The competition is looking at the scoreboard; you should be looking at the trajectory of the ball.

Key Takeaways for Your Strategy:

  • Shift focus from keywords to “Intent Trajectories.” Understand where the user is going, not just where they are.
  • Integrate non-traditional data streams. Use social listening, API data, and macroeconomic signals to find leading indicators.
  • Adopt sophisticated modeling. Move beyond spreadsheets and into Python-based time-series and classification models.
  • Build “Shadow” content. Occupy the semantic space of emergent trends before they hit the mainstream.
  • Balance data with humanity. Use the algorithm to find the “what,” but use human creativity to master the “how.”
The E-E-A-T Blueprint: Why Technical SEO is Only Half the Battle for Google Rankings

In the halcyon days of the early 2010s, SEO was a playground for the technically proficient and the ethically flexible. If you could optimize your crawl budget, sprinkle keywords like fairy dust, and secure a few dozen PBN links from a Russian server farm, you were essentially the king of the SERPs. But the digital landscape has undergone a tectonic shift. Today, the algorithm is no longer a simple pattern-matching machine; it has evolved into a sophisticated arbiter of human credibility. While the technical foundation of a website—its Schema markup, Core Web Vitals, and XML sitemaps—remains the “cost of entry,” the real battle for dominance is won or lost in the murky, qualitative waters of E-E-A-T.

Standing for Experience, Expertise, Authoritativeness, and Trustworthiness, E-E-A-T is not a direct ranking factor in the way a backlink is, but rather a framework used by Google’s Quality Raters to evaluate the efficacy of the algorithm itself. It is the invisible hand that guides which pages rise to the top of the search results and which ones are relegated to the digital graveyard of page two. If you treat SEO as a purely technical endeavor, you are essentially building a state-of-the-art library filled with plagiarized, unverified pamphlets. It might look good on paper, but no one is going to cite it as a source of truth.

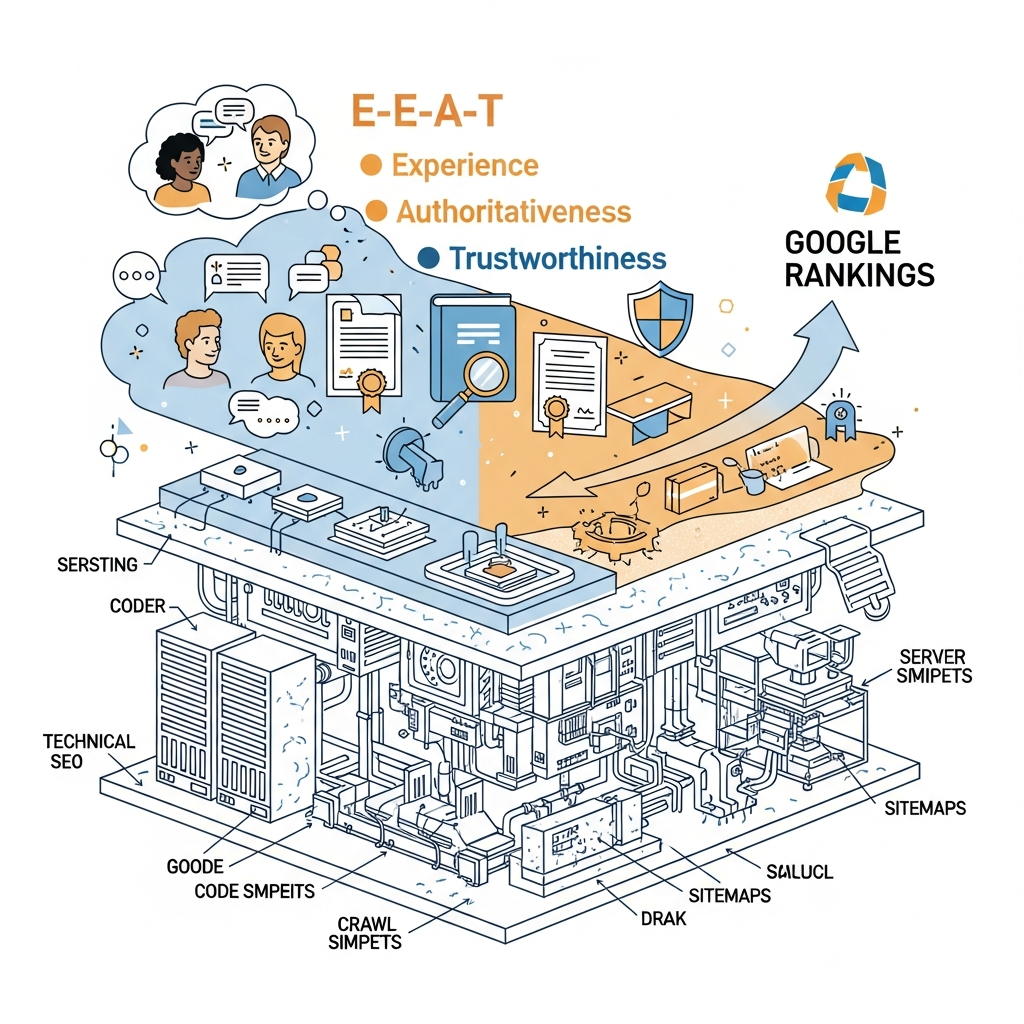
Visual for The E-E-A-T Blueprint: Why Technical SEO is Only Half the Battle for Google Rankings

The Genesis of the E-E-A-T Framework

To understand why E-E-A-T matters, we must look back at the Quality Rater Guidelines (QRG). Google employs thousands of human evaluators whose sole job is to manually check search results and rate their quality. These ratings provide a feedback loop for the engineers to tweak the ranking algorithms. For years, we dealt with E-A-T. Then, in December 2022, Google added an extra “E” for Experience. This wasn’t just a linguistic flourish; it was a fundamental acknowledgment that in an age of generative AI, the “who” and the “how” behind the content are becoming more valuable than the content itself.

Consider the distinction. If you are searching for advice on how to treat a rare cardiac condition, do you want an article written by a “content strategist” who synthesized WebMD articles (Expertise), or do you want the insights of a board-certified cardiologist who has performed three thousand surgeries (Experience + Expertise)? Google’s evolution toward E-E-A-T is an attempt to codify that human preference into a machine-readable format.

The “Experience” Paradox: Why First-Person Narrative Wins

The introduction of Experience was a direct response to the surge of “thin” content. With the advent of Large Language Models (LLMs), any high-schooler can generate a 2,000-word guide on “The Best Hiking Boots for Beginners.” However, that AI cannot tell you how those boots felt on the descent of the Appalachian Trail during a thunderstorm. It cannot describe the specific way the heel friction felt after six miles of damp terrain.

Experience is about the “I.” It is about first-hand involvement. Google is increasingly prioritizing content where the creator has actually utilized the product, visited the location, or lived the experience. This is why Reddit and Quora have seen a massive resurgence in search visibility. Users are hungry for the messy, unpolished reality of human experience, which serves as a powerful antidote to the sanitized, SEO-optimized fluff that has dominated the web for the last decade.

Visual for The E-E-A-T Blueprint: Why Technical SEO is Only Half the Battle for Google Rankings

Deconstructing the Pillars: Expertise, Authority, and the Core of Trust

While Experience is the newcomer, the original pillars remain the bedrock of a successful organic strategy. Let’s dissect them with the clinical precision of a surgeon.

Expertise: The Depth of Knowledge

Expertise refers to the creator of the main content. It is less about the website as a whole and more about the individual behind the keyboard. In the world of YMYL (Your Money Your Life) topics—such as finance, health, and legal advice—expertise is non-negotiable. Google looks for signals that the author is a subject matter expert. This is communicated through:

  • Formal Credentials: Degrees, certifications, and professional licenses.
  • External Validation: Being cited in academic journals or major news outlets.
  • Author Entities: A consistent digital footprint that proves the author exists and is recognized in their niche.

Authoritativeness: The Reputation of the Source

Authoritativeness scales the concept of expertise up to the level of the domain. When other experts or websites in your niche point to you as a source of truth, you gain authority. This is where the old-school concept of “Backlinks” meets the new-school concept of “Digital PR.”

If you write a brilliant piece on astrophysics and NASA links to it, your authoritativeness skyrockets. Why? Because an established authority has effectively vouched for your credibility. It is the digital equivalent of a peer-reviewed endorsement. However, authority is not just about links; it’s about topical relevance. A website that is an authority on gardening will not carry the same weight when it tries to rank for cryptocurrency advice.

Trustworthiness: The Most Important Pillar

In the updated QRG, Google explicitly states that Trustworthiness is the most important member of the E-E-A-T family. It is the central hub. A site can have experience, expertise, and authority, but if it is untrustworthy—perhaps it hides its refund policy, has a history of data breaches, or fails to cite its sources—it will be penalized.

Trust is built through transparency. Does your site have an “About Us” page that features real people? Do you have clear contact information? Are your sources cited with outbound links? If you are an e-commerce site, do you have a plethora of genuine customer reviews? Trust is the filter through which all other E-E-A-T signals are viewed.

Visual for The E-E-A-T Blueprint: Why Technical SEO is Only Half the Battle for Google Rankings

Why Technical SEO is Only the Foundation

Lest we forget our roots, technical SEO is absolutely vital. If Google’s bots cannot crawl your site, or if your JavaScript rendering is a chaotic mess, your E-E-A-T signals won’t even be seen. However, technical SEO has a diminishing marginal return. Once your site is fast, mobile-friendly, and properly indexed, further technical optimizations yield smaller and smaller gains.

“Technical SEO makes a site readable for machines; E-E-A-T makes a site valuable for humans. Google’s algorithm is increasingly bridging the gap between the two.”

Think of technical SEO as the plumbing and electricity in a restaurant. You cannot run a Michelin-star establishment without them. But no one goes to a restaurant because the pipes are 3/4-inch copper or because the wiring is up to code. They go for the food (Experience) and the reputation of the chef (Expertise/Authority). If your SEO strategy is 90% technical and 10% content quality, you are essentially inviting people to dine in a beautifully wired, empty basement.

>The YMYL Nexus: Where E-E-A-T Becomes Life or Death

The stakes of E-E-A-T are not uniform across the web. If you are writing a blog post about the “Best 1980s Synth-Pop Albums,” Google’s standards for E-E-A-T are relatively relaxed. You don’t need a PhD in Musicology to have a valid opinion on Depeche Mode. However, for YMYL categories, the standards are draconian—and rightfully so.

YMYL categories include:

  • Finance: Investment advice, taxes, retirement planning, or loans.
  • Health: Medical conditions, drugs, mental health, or nutrition.
  • Safety: Information on dangerous activities or emergency preparedness.
  • Civics/Law: Voting, legal proceedings, and government information.

In these sectors, Google employs a “disruption of life” metric. If inaccurate information on your page could lead to someone losing their savings or suffering a medical emergency, your E-E-A-T signals must be impeccable. This is where many affiliate marketers hit a brick wall. You cannot rank for “Best Heart Medication” using an AI-written article on a generic domain. Google demands a level of verifiable expertise that most generic content sites simply cannot provide.

>Practical Implementation: Building Your E-E-A-T Blueprint

Moving from the theoretical to the practical, how do we actually “do” E-E-A-T? Since it isn’t a checkbox in a plugin, it requires a holistic approach to brand building. Here is a blueprint for the modern SEO professional.

1. Cultivate and Display Individual Authorship

Stop publishing content under the name of “Admin” or “Editorial Staff.” This is an immediate red flag. Create detailed author bios for every contributor. Link to their LinkedIn profiles, their previous work on other reputable sites, and any professional awards. Use Person Schema to help search engines connect the dots between the author and their digital footprint.

2. The “Information Gain” Strategy

Google recently filed a patent for “Information Gain.” In layman’s terms, this means the algorithm looks for whether your page provides *new* information that wasn’t present in the pages it already crawled. If you are merely summarizing the top 10 results, your information gain is zero. To improve E-E-A-T, add unique data, original photography, or a contrarian viewpoint backed by evidence. This is the essence of “Experience.”

3. Aggressive Fact-Checking and Sourcing

Treat your blog like a journalistic publication. If you make a claim, back it up with a link to a primary source—preferably a .gov, .edu, or high-authority news site. This doesn’t “drain your Link Juice” (a concept that is largely archaic); it reinforces your Trustworthiness. It shows Google that your content is rooted in established fact.

4. Audit Your Digital Footprint (Off-Page E-E-A-T)

E-E-A-T happens mostly off-site. What are people saying about your brand on Reddit? What are your Glassdoor reviews like? Is your business mentioned in Wikipedia? While you can’t always control these factors, you can influence them through Digital PR and community engagement. Mentions on authoritative sites, even without a “dofollow” link, are powerful signals of authority.

>The Role of Schema Markup in the E-E-A-T Framework

While we argued that technical SEO is only half the battle, it is the bridge that communicates E-E-A-T to the bots. Structured Data (Schema) is the language Google uses to understand entities. By using Article, Author, Organization, and ReviewedBy Schema, you are explicitly telling Google who wrote the content, who vetted it, and what their credentials are.

For example, using the reviewedBy property allows you to show that even if a staff writer wrote a medical article, it was checked for accuracy by a licensed doctor. This is a powerful way to leverage the expertise of others to bolster your site’s trustworthiness.

>The AI Elephant in the Room: Can Machines Have E-E-A-T?

The rise of Generative AI has created a crisis of authenticity. AI can mimic Expertise (by synthesizing data) and it can sound Authoritative (by its confident tone), but it fundamentally lacks Experience and Trustworthiness. It cannot “experience” anything. It cannot be held accountable for its mistakes, which is the cornerstone of trust.

Google’s stance on AI content has shifted. They no longer penalize it simply for being AI-generated, but they do penalize it if it lacks E-E-A-T. The irony is that as AI becomes more prevalent, the human elements of content—personal anecdotes, nuanced opinions, and original research—become exponentially more valuable. To future-proof your SEO, don’t just use AI to write content; use it to research, then overlay it with the “human experience” that an LLM cannot replicate.

>Conclusion: The Shift from Optimization to Reputation

In the final analysis, E-E-A-T represents the “humanization” of search. Google is trying to mimic the way a rational, skeptical human being evaluates information. When we look for a lawyer, we don’t just look for who has the fastest-loading website; we look for who has the most experience, the best reputation, and the most transparent fees.

Technical SEO will always be necessary. It ensures that your “digital store” is open, the lights are on, and the aisles are organized. But E-E-A-T is why people choose to shop there instead of at the competitor down the street. It is the cumulative effect of your brand’s reputation, your authors’ expertise, and the genuine value you provide to your audience.

Stop asking, “How can I rank for this keyword?” and start asking, “Do I deserve to rank for this keyword?” If the answer is “no,” then no amount of Schema or site speed optimization will save you from the eventual algorithmic correction. The blueprint for success in modern SEO is simple, yet incredibly difficult to execute: Be the authority you claim to be.

As we move deeper into this decade, the gap between “good content” and “trustworthy content” will continue to widen. Those who invest in building a brand rooted in E-E-A-T will find themselves insulated from the volatility of algorithm updates, while those who rely on technical hacks will be forever chasing a moving target. SEO is no longer just a technical department; it is a reputation management department. Treat it accordingly.

Semantic Content Clustering: How to Build Topic Authority in a Post-Keyword World

The era of keyword-focused SEO is officially in the rearview mirror. If you are still building content calendars around high-volume, low-competition keywords as standalone targets, you are essentially trying to build a modern skyscraper on a foundation of sand. Google has evolved. The algorithms—Hummingbird, RankBrain, BERT, and now MUM—don’t just read your words; they understand your intent. They are looking for context, authority, and semantic relevance.

Search engines no longer view “strings” of text; they view “things”—entities and the relationships between them. This shift necessitates a complete overhaul of how we approach content strategy. Enter: Semantic Content Clustering. This isn’t just another buzzword to throw around in marketing meetings. It is the architectural blueprint for building topical authority in an environment where AI-driven search engines prioritize depth over breadth.

Visual for Semantic Content Clustering: How to Build Topic Authority in a Post-Keyword World

The Death of the Keyword and the Birth of the Entity

For years, the playbook was simple: find a keyword, check the volume, write a 1,500-word post, and pray for a backlink. That strategy is failing. Why? Because Google has moved toward Semantic Search. Semantic search is the process by which search engines attempt to produce the most accurate results by understanding searcher intent, query context, and the relationship between words.

Consider the word “Apple.” Without context, a search engine doesn’t know if you want the fruit, the tech giant, or the record label. Semantic SEO provides that context. By clustering content around a central theme, you signal to Google that your site isn’t just a collection of random articles, but a comprehensive knowledge base—a definitive source of truth for an entire topic area.

“SEO is no longer about being the best answer for a specific keyword; it’s about being the best answer for a specific journey.”

Visual for Semantic Content Clustering: How to Build Topic Authority in a Post-Keyword World

Defining Semantic Content Clustering

Semantic content clustering is the strategic organization of your website’s content into interconnected “hubs” and “spokes.” Instead of creating disparate pages, you create a Pillar Page (the hub) that provides a comprehensive overview of a broad topic and then link it to multiple Cluster Pages (the spokes) that dive deep into specific subtopics.

This structure does three critical things for your SEO:

  • Improves Crawlability: It creates a clean, logical site architecture that helps search bots find and index your content faster.
  • Increases Topical Authority: By covering every facet of a topic, you prove to Google that you have “Topical Breadth,” a key component of the E-E-A-T (Experience, Expertise, Authoritativeness, Trustworthiness) framework.
  • Boosts User Engagement: It keeps users on your site longer by providing logical next steps in their learning journey.
Visual for Semantic Content Clustering: How to Build Topic Authority in a Post-Keyword World

The Anatomy of a High-Authority Content Cluster

Building a cluster isn’t about volume; it’s about architecture. You need four distinct elements to make a semantic cluster work effectively.

1. The Pillar Page (The Hub)

The pillar page is the high-level overview. It should be broad enough to encompass dozens of subtopics but detailed enough to stand on its own. Think of it as the “Ultimate Guide” or the “Masterclass” page. It targets a high-volume, high-competition broad term.

2. The Cluster Content (The Spokes)

These are your deep dives. Each cluster page focuses on a specific long-tail keyword or question related to the pillar. If your pillar is “Digital Marketing,” your cluster pages might be “How to Set Up Google Ads,” “The Future of AI in Social Media,” or “A Guide to Retargeting Pixels.”

3. The Internal Linking Graph (The Connective Tissue)

This is where the magic happens. All cluster pages must link back to the pillar page, and the pillar page must link out to all cluster pages. Ideally, cluster pages should also link to each other where contextually appropriate. This creates a “semantic loop” that passes link equity and context throughout the entire silo.

4. Semantic Breadth (The Context)

To truly build authority, your cluster must include LSI (Latent Semantic Indexing) keywords and related entities. If you’re writing about “Mountain Biking,” search engines expect to see terms like “suspension,” “trail ratings,” “hardtail,” and “downhill geometry.” If those entities are missing, your cluster is semantically incomplete.

>Step-by-Step: How to Build Your Semantic Roadmap

As an elite copywriter, I don’t just “write.” I engineer. Here is the exact process for building a cluster that dominates the SERPs.

Step 1: Identify Your Core Entity

Don’t start with a keyword tool. Start with your business goals. What is the one thing you want to be known for? This is your core entity. If you are a SaaS company selling CRM software, your core entity is “Customer Relationship Management.” Everything you write should orbit this sun.

Step 2: Map the Semantic Universe

Use tools like Google’s “People Also Ask,” AnswerThePublic, and AI models to identify every question a user might have regarding your core entity. You are looking for intent patterns. Organize these into categories: Information-seeking, Navigational, and Transactional. Your cluster should serve all three.

Step 3: Audit Existing Content

You likely already have “zombie content”—old posts that are underperforming. Don’t delete them. Refactor them. Map your existing articles to your new cluster categories. If a post doesn’t fit into a cluster, it’s a distraction and should either be rewritten or redirected.

Step 4: Execute the “Inverted Pyramid” of Content

Write your pillar page first, but don’t publish it until you have at least 5-10 cluster pages ready to go. Launching a pillar page without its supporting spokes is like launching a ship without a crew. Once the cluster is live, use descriptive anchor text for your internal links. Avoid “click here” or “read more.” Use anchors like “advanced B2B lead generation strategies” to tell Google exactly what the destination page is about.

>The Technical Side of Semantic Authority: Schema and JSON-LD

You cannot ignore the “machine-readable” side of semantic SEO. While your content is for humans, your metadata is for the bots. To solidify your topic authority, you must use Structured Data (Schema.org).

By implementing “About” and “Mentions” schema, you can explicitly tell Google which entities your page is discussing. If your pillar page mentions “Cloud Computing,” use Schema to link that term to the Wikipedia entry for Cloud Computing. This removes any ambiguity for the search engine and cements your page’s place in the Knowledge Graph.

>Advanced Strategy: Leveraging “Searcher Task Accomplishment”

Google’s recent updates have placed a heavy emphasis on whether a user actually finishes their “task” on your site. If they read your cluster page and then have to go back to Google to search for a related question, you have failed the semantic test.

Your cluster should be a closed ecosystem. Anticipate the “next” question. If they are reading about “How to Start a Podcast,” the next logical question is “What is the best podcasting microphone?” Your cluster should have that answer ready and linked. When Google sees that users land on your site and stay there to satisfy their entire search journey, your authority will skyrocket.

>Common Pitfalls in Semantic Clustering

Even the best marketers stumble here. Avoid these three common mistakes:

  • Keyword Cannibalization: Don’t create two cluster pages that target the same intent. If “best SEO tools” and “top SEO software” serve the same purpose, merge them. Semantic SEO is about distinct concepts, not different wordings.
  • Weak Pillars: A pillar page that is too short won’t rank. It needs to be a definitive resource. If you can’t get at least 2,500 words of high-quality, non-fluff content on your pillar page, your topic might be too narrow.
  • Broken Links: In a cluster, the link is the currency. A broken link or a “nofollow” tag on an internal link in your cluster is like a leak in a dam. It wastes all your topical power.

>The Role of AI in Semantic Content Creation

We are in a “Post-Keyword World” largely because of Large Language Models (LLMs). Google is using AI to understand you, so you should use AI to understand Google. Use tools like SurferSEO, Frase, or Clearscope to identify the semantic gap between your content and the top-ranking results.

These tools analyze the “Corpus” of the top 10 results and tell you which entities you are missing. If the top 10 pages for “Sustainable Investing” all mention “ESG Scores” and “Carbon Offsets,” and your page doesn’t, you will never rank for that topic, regardless of your keyword density.

>Measuring the Success of Your Topic Authority

Traditional SEO metrics like individual keyword rankings are becoming less relevant. To measure the success of a semantic cluster, look at these KPIs:

  • Topical Share of Voice: How much of the total search traffic for a specific category do you own?
  • Organic Pages per Session: Are users moving from one cluster page to another?
  • Ranked Keywords per Page: A successful semantic page should rank for hundreds, if not thousands, of long-tail variations, not just one primary term.
  • Internal Link Through-Put: Use Search Console to see if your pillar page is passing impressions to your cluster pages.

>Future-Proofing Your Strategy: SGE and Beyond

With the advent of Google’s Search Generative Experience (SGE), the “zero-click search” is becoming more common. AI will summarize your content directly on the results page. You might think this is bad for traffic, but it’s actually an opportunity. Google cites its sources in SGE. By being the most authoritative cluster on a topic, you ensure that you are the source Google chooses to cite.

The goal is no longer to get the “click” for a simple question; the goal is to be the authority for the complex journey. Simple questions get answered by AI; complex strategies and deep dives require human-led authority. That is where you win.

>Conclusion: The Architecture of Trust

Semantic content clustering is more than an SEO tactic; it is a commitment to quality. It requires you to stop thinking like a “search engine optimizer” and start thinking like a “subject matter expert.” When you build a cluster, you aren’t just trying to trick an algorithm into ranking you higher. You are building a comprehensive map of a topic, helping users navigate complex information, and establishing a level of trust that no single “keyword-optimized” post could ever achieve.

The transition from keywords to topics is a transition from being a solicitor to being a consultant. In a world saturated with AI-generated noise, authority is the only currency that still holds value. Build your clusters, connect your entities, and dominate your niche by being the most thorough, logical, and helpful resource on the web.

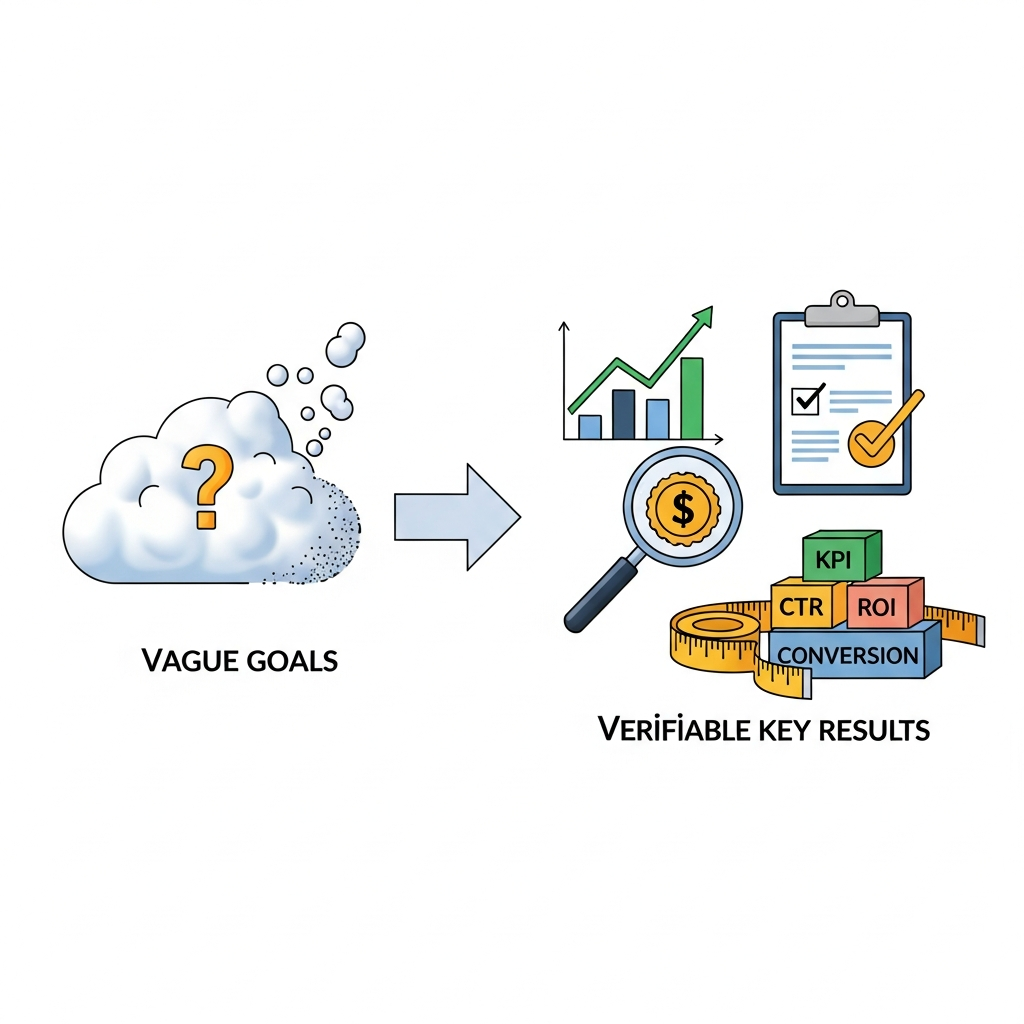
OKRs in Marketing: Transitioning from “Vague Goals” to Verifiable Key Results

Let’s be brutally honest for a moment: Most marketing departments are running on a treadmill of “busy-work” while hallucinating progress. You’ve seen it. I’ve seen it. The Monday morning meetings where someone says, “We need to increase brand awareness,” or “Let’s focus on engagement this quarter.”

Those aren’t goals. Those are wishes. They are soft, pillowy cushions designed to protect marketing teams from the cold, hard reality of accountability. If you can’t measure it with a definitive ‘yes’ or ‘no’ at the end of the quarter, it’s not a result—it’s a hobby.

This is where the OKR (Objectives and Key Results) framework enters the room like a cold splash of water. Born at Intel and perfected at Google, OKRs are the antidote to the “vague-goal syndrome” that plagues modern marketing. Transitioning from fuzzy aspirations to verifiable key results isn’t just a management tweak; it’s a fundamental rewiring of how your team thinks, breathes, and executes.

Visual for OKRs in Marketing: Transitioning from

The Fundamental Anatomy of a Marketing OKR

Before we dive into the weeds of implementation, we need to clarify what we’re actually building. An OKR consists of two distinct components that work in tandem to create both inspiration and execution.

The Objective (The “Where”): This is your North Star. It is qualitative, inspirational, and designed to get the team out of bed in the morning. An objective doesn’t have a number in it. It describes a desired future state. Example: “Become the most trusted educational resource for first-time home buyers.”

The Key Results (The “How”): These are the yardsticks. They are quantitative, time-bound, and—this is the non-negotiable part—verifiable. If an Objective is the destination, the Key Results are the GPS coordinates that prove you’ve arrived. Example: “Achieve 50,000 monthly organic visits to the ‘Home Buying 101’ hub.”

In marketing, we often confuse these two. We treat “getting more leads” as an objective when it’s actually a key result. We treat “launching a new campaign” as a result, when it’s actually just a task. To win with OKRs, you must separate the impact from the activity.

Visual for OKRs in Marketing: Transitioning from

Why Marketing Teams Struggle with “Vague Goals”

Marketing is inherently creative, and creative people often recoil at the thought of rigid metrics. There is a prevailing fear that if we track everything, we lose the “magic.” This is a fallacy. In reality, metrics provide the guardrails that allow creativity to be effective rather than just decorative.

The “Vague Goal” trap usually stems from three specific failures in leadership:

  • Fear of Failure: If a goal is vague (e.g., “Improve social media presence”), it is impossible to fail. You can always find a metric that went up. OKRs remove this safety net.
  • The Activity Trap: Many marketers believe that being busy equals being productive. They mistake “sending 10 emails” for “generating revenue.”
  • Lack of Strategic Alignment: When the marketing team doesn’t know how their work impacts the bottom line, they default to vanity metrics like “likes” and “impressions.”

To transition to verifiable results, you must first foster a culture where failure is seen as data, and where “getting it done” is secondary to “making it matter.”

Visual for OKRs in Marketing: Transitioning from

The Shift from Outputs to Outcomes

If you take nothing else away from this guide, remember this: Key Results are about outcomes, not outputs.

An output is something you do (e.g., write a whitepaper). An outcome is the result of that action (e.g., 500 qualified leads from that whitepaper). Marketing teams that are new to OKRs almost always fill their “Key Results” section with a to-do list. They write things like:

  • “Launch the new website.”
  • “Run a LinkedIn ad campaign.”
  • “Publish 12 blog posts per month.”

These are not Key Results. These are Initiatives. You could launch a beautiful website that converts at 0% and does nothing for the business. Did you “hit” your goal? Technically, yes. Did you help the company? Absolutely not.

A verifiable Key Result for a website launch would look like this: “Increase website conversion rate from lead-to-MQL from 2.1% to 3.5% by Q3.” Now, you aren’t just launching a site; you’re optimizing for performance. The “launch” is just the tool you use to hit the number.

>Crafting Verifiable Key Results: The “So What?” Test

How do you know if your Key Result is actually verifiable and valuable? You put it through the “So What?” test. Imagine you tell your CEO you hit your KR. If they say “So what?” and you don’t have an answer that involves money, market share, or growth, your KR is weak.

Let’s look at a typical transition from a vague goal to a verifiable KR:

Vague Goal: “Improve our SEO and get more traffic.”
Refined KR (Output-based): “Publish 20 SEO-optimized articles.”
The “So What?” Reality (Outcome-based): “Increase organic search traffic to the pricing page from 500 to 2,000 sessions per month.”

The third option is verifiable. At the end of the quarter, the analytics dashboard will show a number. It is binary. You either hit 2,000 or you didn’t. There is no room for “we felt like the traffic was better.”

>OKRs for Different Marketing Verticals

Marketing is a broad church. The OKRs for a Brand Manager will look vastly different from those of a Performance Marketer. Let’s break down how to apply this rigor across different specialties.

1. Content Marketing & SEO

Content is the king of “vague goals.” We often hide behind the idea that content is a “long-term play” to avoid immediate accountability. While true, we still need verifiable milestones.

Objective: Establish our brand as the undisputed thought leader in the AI-automation space.

  • KR 1: Achieve 3 top-3 rankings for high-intent keywords with a total search volume of 10k+.
  • KR 2: Secure 5 placements in Tier-1 industry publications (e.g., TechCrunch, Wired).
  • KR 3: Increase average time-on-page across the blog from 1:20 to 2:45.

2. Demand Generation & Paid Media

Paid media is already data-heavy, but it often focuses on the wrong data (CPC instead of CAC). OKRs help align paid spend with business health.

Objective: Hyper-scale our lead generation engine without sacrificing lead quality.

  • KR 1: Increase monthly Sales Qualified Leads (SQLs) from 150 to 300.
  • KR 2: Maintain a Customer Acquisition Cost (CAC) of under $450.
  • KR 3: Increase the “Lead-to-Opportunity” conversion rate from 12% to 18%.

3. Brand & Communications

This is the hardest area to quantify, which makes OKRs even more vital here. Don’t let “brand” be a black hole for budget.

Objective: Create a “fanatical” following that differentiates us from commoditized competitors.

  • KR 1: Increase Net Promoter Score (NPS) from 45 to 60.
  • KR 2: Grow branded search volume from 5,000 to 8,500 monthly queries.
  • KR 3: Achieve a 15% share of voice in the “Enterprise Security” category.

>The Rule of Three: Avoid OKR Bloat

One of the most common mistakes I see in high-growth marketing teams is “OKR Bloat.” They try to track 15 different Key Results for a single objective. This is a recipe for mediocrity. When everything is a priority, nothing is a priority.

The Golden Rule: 1 Objective, 3 to 5 Key Results. Maximum.

If you have more than five KRs, you aren’t focused. You’re just listing your department’s entire dashboard. OKRs are meant to highlight the *most* important levers for growth this quarter. Everything else is just “business as usual” (BAU). Don’t mix your daily tasks with your OKRs.

>The Cultural Shift: High-Trust Accountability

Transitioning to verifiable results requires a psychological shift. In a traditional marketing setup, failing to hit a goal is often seen as a performance issue. In an OKR setup, failing to hit a “stretch goal” is often expected.

Google famously aims for a 60-70% success rate on their OKRs. If you hit 100% of your Key Results, you didn’t win—you “sandbagged.” You set the bar too low. You played it safe.

For a marketing team to embrace this, leadership must reward transparency. If a team realizes halfway through the quarter that their Key Result of “2,000 leads” was wildly optimistic because the market shifted, they should be able to pivot or discuss it openly without fear of retribution. The goal is alignment, not punishment.

>Implementing the OKR Cycle in Marketing

You can’t just set OKRs in January and check them in December. That’s how goals go to die. The OKR framework requires a rhythm—a heartbeat.

Phase 1: The Planning (Week 0)

The CMO or Marketing Director sets the top-level Objective based on the company’s annual goals. The individual teams (Content, Paid, Product Marketing) then draft their own OKRs that support that top-level objective. This is “bidirectional” goal setting. It’s not just top-down; it’s collaborative.

Phase 2: The Weekly Check-in

Every week, spend 15 minutes reviewing the numbers. Are we “On Track,” “At Risk,” or “Off Track”? This prevents “End-of-Quarter Panic,” where teams realize on week 11 that they haven’t moved the needle at all.

Phase 3: The Scoring & Retrospective

At the end of the quarter, score your KRs on a scale of 0.0 to 1.0. A 0.7 is a “green” (great success). A 1.0 is a “miracle” (you sandbagged). A 0.3 is a “red” (total failure). The most important part is the Retrospective: Why did we miss? Was it the strategy, the execution, or the goal itself?

>Common Marketing OKR Pitfalls to Avoid

Even the best marketing minds fall into these traps. Keep an eye out for these red flags:

  • The “And” KR: “Increase traffic and decrease bounce rate and improve conversions.” This is three KRs disguised as one. Break them apart.
  • Lagging-only Metrics: Revenue is a lagging indicator. It takes time to show up. Balance your OKRs with “leading indicators”—metrics that predict future success (e.g., “Demo requests” is a leading indicator for “Revenue”).
  • The “Vanish” KR: Setting a KR that you have no way of tracking today. If you don’t have the tooling to measure “Brand Sentiment” accurately, don’t make it a KR until you’ve built the measurement system.

>Tools for Tracking: Don’t Overcomplicate It

I’ve seen companies spend $50,000 on OKR software only to have the team hate using it. If you’re just starting, a shared Google Sheet or a simple Notion database is more than enough. The magic is in the conversations the framework triggers, not the software used to record it.

As you scale, tools like GTMHub or Lattice can help align thousands of employees, but for a 20-person marketing team? Keep it lean. Focus on the data, not the interface.

>The Competitive Advantage of Verifiable Marketing

In a world of tightening budgets and AI-driven competition, “vague” marketers are the first to be replaced. CEOs and CFOs are tired of hearing about “engagement” when the pipeline is dry. By moving to verifiable Key Results, you change the perception of marketing from a cost center to a profit center.

You stop being the department that “makes things pretty” and start being the department that “drives predictable growth.”

Is it harder? Yes. Does it require more math? Definitely. But it also provides a level of clarity and confidence that vague goals never can. When you hit a 0.7 on a truly ambitious, verifiable Key Result, you don’t just feel like you did a good job—you have the data to prove it.

>Conclusion: Start Small, but Start Now

Don’t try to overhaul your entire marketing philosophy by next Monday. Start by taking your biggest “Vague Goal” for this quarter and putting it through the grinder. Strip away the fluff. Ask “So what?” until you find the number that actually matters.

Transitioning to OKRs is a muscle. The first quarter will be clunky. Your goals will be poorly written. You will miss your targets. But by the third quarter, you’ll look back at your old way of working and wonder how you ever got anything done in the fog.

Marketing isn’t a guessing game. It’s a series of hypotheses tested against reality. OKRs are simply the way we record the results. Stop wishing for growth and start verifying it.

The 5-Phase Protocol: How Methodological Rigor Guarantees Scalable Results.

Scaling a business, a technical infrastructure, or a high-performance team is often viewed through a lens of chaotic growth. We celebrate the “hustle,” the late nights, and the “move fast and break things” mantra. But let’s be brutally honest: breaking things is expensive. In the world of high-stakes operations, unplanned breakage is a symptom of structural failure, not a badge of honor. To achieve true, sustainable scale—the kind that doesn’t collapse under its own weight—you need more than ambition. You need a protocol.

I’ve spent the better part of two decades dissecting why some organizations explode into market dominance while others plateau and wither. The differentiator is never just “better marketing” or “more funding.” It is methodological rigor. It is the transition from intuitive management to systemic execution. This is where the 5-Phase Protocol comes into play.

This isn’t a collection of “productivity hacks.” This is a foundational framework for engineering growth. If you are looking for shortcuts, you won’t find them here. If you are looking for a roadmap to building a machine that produces predictable, scalable results, let’s dive in.

Visual for The 5-Phase Protocol: How Methodological Rigor Guarantees Scalable Results.

Phase 1: Deep Discovery and the Environmental Audit

Most leaders suffer from the “Solution First” bias. They see a problem and immediately reach for a tool or a tactic. Phase 1 of the protocol demands that you stop. Before a single line of code is written or a new hire is onboarded, you must perform a comprehensive environmental audit.

Discovery is the process of uncovering the Ground Truth. This isn’t the truth as presented in your quarterly reports or what your middle managers tell you during a synchronized slide deck presentation. Ground Truth is the granular, often ugly reality of your current operations. It involves identifying the “ghost in the machine”—those informal processes that employees use to bypass broken official systems.

The Anatomy of a Rigorous Audit

  • Data Integrity Check: Are the metrics you’re tracking actually reflective of health? If you’re scaling a sales team, are you looking at raw lead count, or are you tracking the velocity of qualified pipeline?
  • Dependency Mapping: Every system has bottlenecks. You need to map out every single dependency. If Person A leaves, does Process B collapse? If a third-party API goes down, does your entire service layer fail?
  • Cultural Resistance Assessment: Scaling requires change. You must identify who will be your champions and who will be your anchors. Ignoring the human element at this stage is a recipe for internal sabotage later.

The goal of Phase 1 is to eliminate “Assumed Knowledge.” When you assume you know why a process is failing, you build a solution for a phantom problem. Methodological rigor starts with the humility to admit you might be wrong about your own business.

“The greatest obstacle to discovery is not ignorance—it is the illusion of knowledge.” — Daniel J. Boorstin

Visual for The 5-Phase Protocol: How Methodological Rigor Guarantees Scalable Results.

Phase 2: Architectural Modeling and Logic Frameworks

Once the audit is complete, we move into the blueprinting phase. In the 5-Phase Protocol, this is where we design the Scalable Architecture. Think of this as the difference between building a shed and building a skyscraper. You can’t just “add floors” to a shed; the foundation isn’t built for it. You have to design the skyscraper to be a skyscraper from day one.

Architectural modeling involves defining the logic that will govern your growth. This means moving away from “How do we do this?” and toward “How do we build a system that does this automatically?”

The Principle of Modular Design

A scalable system must be modular. Whether you are building software or a customer success team, the components should be able to function independently and interface through clearly defined protocols. In software, we call these APIs. In business, we call them Standard Operating Procedures (SOPs) and Key Performance Indicators (KPIs).

If your growth relies on one “genius” in the room making every decision, you haven’t built a scalable model; you’ve built a bottleneck. Phase 2 focuses on de-risking the individual. We build frameworks where the process is the star, not the person. This allows you to plug in talent and see immediate results because the “logic” of the role is already established.

Designing for Failure (The Pre-Mortem)

Rigorous architecture includes a “Pre-Mortem.” We ask: “It is one year from now and this project has failed. Why did it happen?” By imagining failure in the modeling phase, we can build safeguards directly into the architecture. We don’t just plan for success; we engineer against failure.

Visual for The 5-Phase Protocol: How Methodological Rigor Guarantees Scalable Results.

Phase 3: Controlled Execution (The Beta Loop)

Now we reach the stage where most people get impatient. They have the plan, they have the data, and they want to flip the switch for the entire company. Do not do this.

Phase 3 is about Controlled Execution. In the tech world, we call this a Beta test or a Canary release. In the broader business world, it’s a pilot program. The objective here isn’t to achieve massive results; it’s to validate the logic frameworks you built in Phase 2 under real-world conditions.

The “Sandbox” Methodology

You need a “sandbox”—a small, isolated segment of your market or operation where you can deploy the new protocol without risking the entire enterprise. This allows you to observe how the system handles stress, variance, and the “human factor.”

During Phase 3, your primary job is to find the friction. Where did the SOPs fail? Where did the data flow break? Controlled execution is about failing small to learn big. Every error caught in the Beta Loop is an error that doesn’t cost you $10 million when you move to Phase 5.

  • Short Feedback Cycles: In this phase, feedback should be daily, not monthly.
  • Iterative Refinement: If a process isn’t working, you don’t scrap the protocol; you refine the module. This is the essence of agility.
  • Documenting Variance: Keep a rigorous log of everything that didn’t go according to the blueprint. These are your “Optimization Nodes.”

>Phase 4: Optimization and Performance Tuning

If Phase 3 was about “Does it work?”, Phase 4 is about “How do we make it perfect?” This is where the 5-Phase Protocol transitions from a functional system to a high-performance engine. Optimization is the stage where you squeeze every ounce of efficiency out of your processes.

Many organizations skip this step. They see that the pilot program worked, and they immediately scale it. This is a massive mistake. Scaling an unoptimized process is simply scaling waste. If your customer acquisition cost is slightly too high in the pilot, it will become a hemorrhaging wound when you scale 100x.

The 80/20 of Optimization

In this phase, we apply the Pareto Principle. We identify the 20% of actions that are driving 80% of the results and we double down on them. Conversely, we look for the “Tail”—the activities that consume resources but provide marginal utility. We prune the tail ruthlessly.

Technical Debt and Process Debt: This is the time to pay it down. If you cut corners in Phase 3 to get the pilot live, you must fix those shortcuts now. In Phase 5, those shortcuts become structural cracks. Performance tuning involves upgrading your tools, training your people to a higher level of mastery, and automating repetitive tasks that were previously done manually for the sake of speed.

Zero-Based Budgeting for Growth

In Phase 4, we also look at resource allocation. We don’t just add 10% to last year’s budget. we look at every resource—time, money, and talent—and ask: “If we started from scratch today, would we invest this here?” If the answer is no, those resources are redirected to the high-leverage areas identified during the audit.

>Phase 5: Radical Scaling and Institutionalization

Finally, we reach the endgame. You have a validated, optimized, and stress-tested system. Now, and only now, do you pour the fuel on the fire. Phase 5 is about Radical Scaling.

Scaling isn’t just about doing more of the same; it’s about maintaining the integrity of the results while increasing volume. This is achieved through Institutionalization—the process of turning your protocol into the “cultural DNA” of the organization.

The Flywheel Effect

When you reach Phase 5, the protocol should start to generate its own momentum. Jim Collins famously called this the “Flywheel Effect.” In the beginning, it takes massive effort to get the wheel to turn. But because you followed the methodological rigor of the first four phases, the wheel is perfectly balanced and lubricated. Eventually, the weight of the system itself starts to drive the growth.

  • Automation of Governance: Use technology to monitor compliance with the protocol. Dashboards should alert you the moment a KPI deviates from the expected range.
  • Hyper-Documentation: Your SOPs should be so robust that a new hire can be onboarded and become productive within days, not months.
  • Continuous Evolution: Even in the scaling phase, the protocol is not static. It is a living framework that incorporates feedback from the front lines to stay ahead of market shifts.

The Danger of “Ego-Scaling”

The biggest threat in Phase 5 is ego. Leaders often get confident and start ignoring the protocol that got them there. They start making “gut instinct” bets again. Methodological rigor requires a level of discipline that many find uncomfortable. You must remain a student of your own system. Don’t scale because your ego wants to see a bigger number; scale because the data shows the system can handle the load.

>Why Methodological Rigor is the Only Real Security

We live in an era of volatility. Markets shift, technologies disrupt, and global events can upend an industry overnight. In this environment, “talent” is not enough. “Luck” is not a strategy. The only real security you have is the rigor of your methods.

A rigorous protocol allows you to pivot with precision. When you have a modular, well-documented system, you can swap out a failing component without crashing the whole machine. You can identify exactly where a problem is occurring because you have the data and the visibility to see it. That is the power of the 5-Phase Protocol.

It’s not the easiest way to grow. It requires more upfront work, more discipline, and a willingness to confront uncomfortable truths. But it is the guaranteed way to scale. If you want results that are predictable, repeatable, and scalable, you have to stop playing and start engineering.

Success is a byproduct of the system. Build a better system, and the success will take care of itself.

>The Human Factor: Why Most Fail the Protocol

If this protocol is so effective, why isn’t everyone using it? Because it requires a psychological shift that many are unwilling to make. It requires moving from the “Hero” archetype to the “Architect” archetype.

The “Hero” leader loves to swoop in and save the day. They thrive on the adrenaline of a crisis. But in a truly scalable, rigorous system, there are no crises to save. Everything is handled by the protocol. For some, this feels boring. They miss the “firefighting.”

To succeed with the 5-Phase Protocol, you must find your satisfaction in the elegance of the machine rather than the drama of the rescue. You must value consistency over intensity. Rigor is a quiet virtue, but in the world of high-performance scaling, it is the loudest differentiator there is.

Are you ready to stop hustling and start building? The protocol is waiting.

Diagnostic vs. Reactive: Why a Marketing Audit Should Always Precede Your Ad Spend

Imagine walking into a doctor’s office with a chronic cough, and before you even sit down, the physician hands you a prescription for high-dosage antibiotics and schedules you for a lung biopsy. No stethoscope. No blood tests. No questions about your history. You would walk out immediately, wouldn’t you? You would call it malpractice.

Yet, in the high-stakes world of digital growth, businesses commit the marketing equivalent of this every single day. They see a dip in sales or a plateau in growth and immediately “prescribe” more ad spend. They dump five, ten, or fifty thousand dollars into Meta, Google, or LinkedIn, hoping the sheer volume of traffic will drown their problems. It rarely does. Instead, they end up with a high-speed delivery system for a broken message, a leaky funnel, or a product-market mismatch.

This is the difference between reactive marketing and diagnostic marketing. One is a desperate gamble; the other is a strategic blueprint. In this guide, we are going to tear apart the myth that “more ads” is the solution to stagnant growth and explain why a comprehensive marketing audit is the only logical step before touching your credit card.

Visual for Diagnostic vs. Reactive: Why a Marketing Audit Should Always Precede Your Ad Spend

The Fatal Allure of Reactive Marketing

Reactive marketing is born out of anxiety. It’s the “we need leads yesterday” mentality. When a CEO looks at a dashboard and sees red, the first instinct is to turn the dials. “Double the daily budget on the retargeting campaign! Launch a new PMax campaign! Hire an agency that promises 10x ROI in 30 days!”

The problem with this approach is that it treats symptoms rather than causes. If your conversion rate is low, doubling your traffic just means you are paying twice as much to watch people leave your site. Reactive marketing is inherently expensive because it relies on brute force. It ignores the underlying “plumbing” of your brand’s digital presence.

“Pouring money into ads without an audit is like trying to fill a bucket with holes by using a larger hose. You might get more water in the bucket temporarily, but the waste is astronomical.”

When you react, you lose leverage. You are at the mercy of platform algorithms and rising CPMs. You haven’t earned the right to scale because you haven’t proven that your ecosystem can handle the pressure of increased volume.

Visual for Diagnostic vs. Reactive: Why a Marketing Audit Should Always Precede Your Ad Spend

The Diagnostic Approach: The Audit as a Foundation

Diagnostic marketing assumes that something is always broken—or at least, something can always be optimized. A marketing audit isn’t just a “check-up.” It is a deep-tissue scan of your entire go-to-market strategy. It looks at the technical, the psychological, and the financial aspects of your business.

Before you spend a single dollar on an ad, you must have answers to the following questions:

  • Is the tracking actually working? You’d be surprised how many Seven-figure brands have broken GA4 setups or misfiring pixels.
  • Does the landing page match the intent? If you’re bidding on “best accounting software” but your landing page talks about “enterprise financial transformation,” you’ve already lost.
  • What is the “true” CAC? Many companies calculate Customer Acquisition Cost (CAC) incorrectly, ignoring the overhead or the blended impact of organic traffic.
  • Who is the actual buyer? Not the “persona” you wrote three years ago, but the person actually clicking and buying today.

1. The Technical Audit: Fixing the Leaky Pipe

Most ad spend waste happens at the technical level. If your website takes four seconds to load on a mobile device, you are losing up to 50% of your paid traffic before they even see your headline. That is a 50% tax on your ad spend that no amount of “better creative” can fix.

A diagnostic audit starts with the “plumbing.” This includes Core Web Vitals, mobile responsiveness, and the checkout or lead-gen flow. If there is friction—if a button is hard to click or a form has twelve fields when it only needs three—your ad spend is being lit on fire. You must audit the user journey from the first click to the final confirmation page.

2. The Messaging Audit: Is Anyone Listening?

In a world of infinite scrolls and goldfish-level attention spans, your messaging is your only weapon. Most reactive marketing fails because the messaging is “me-centric.” It’s all about the features, the “we’ve been in business since 1994,” and the “award-winning service.”

A diagnostic audit peels back the layers of your copy. We look for Product-Market Fit resonance. Are you speaking to the customer’s pain, or are you just shouting about your solution? We analyze the “Hook-Value-Call to Action” framework across all touchpoints. If your ads are saying one thing and your website is saying another, the cognitive dissonance will kill your conversion rate.

Visual for Diagnostic vs. Reactive: Why a Marketing Audit Should Always Precede Your Ad Spend

Why Most Agencies Skip the Audit

If audits are so vital, why does every agency want to start running ads on day one? The answer is simple: Billable hours and immediate gratification.

Audits are hard work. They require high-level thinking, data science, and a willingness to tell the client their “baby is ugly.” It’s much easier for an agency to say, “Give us $10,000 for management and $50,000 for spend, and we’ll start testing.” Testing is often just a euphemism for “we don’t know what we’re doing, so we’re using your money to find out.”

An elite marketer will refuse to run ads without a diagnostic phase. They know that their reputation depends on ROI, and ROI is impossible to guarantee if the foundation is built on sand. When you pay for an audit, you are paying for a map. When you pay for reactive ads, you are paying for gas in a car with no steering wheel.

>The Pillars of a High-Impact Marketing Audit

If you are serious about scaling, your audit needs to cover four specific pillars. Skipping one is like trying to fly a plane with one wing missing.

Pillar 1: Data Integrity & Attribution

If you cannot measure it, you cannot manage it. In the post-iOS14 world, attribution is messy. A diagnostic audit looks at your “Source of Truth.” Are you relying solely on the Facebook Ads Manager dashboard (which often over-reports)? Or are you looking at Marketing Efficiency Ratio (MER) and First-Party Data?

We need to see where the drop-offs are. Is there a specific step in the funnel where 80% of users vanish? That is a data signal. A diagnostic audit turns “I think” into “I know.”

Pillar 2: Competitive Intelligence

You do not operate in a vacuum. Your competitors are bidding on the same keywords and targeting the same audiences. A reactive approach ignores the competition until they start stealing market share. A diagnostic approach analyzes their creative hooks, their pricing strategy, and their backlink profile.

Pro Tip: Use tools like the Meta Ad Library to see what your competitors have been running for more than 90 days. If an ad has been active for three months, it’s likely profitable. That is free data for your audit.

Pillar 3: Offer Architecture

Sometimes the ads aren’t the problem. Sometimes the offer is the problem. If you are offering a “Free Consultation” in a market where everyone else is offering a “Free Audit + 30-Day Roadmap,” you are going to lose. Your offer needs to be “Irresistible” in the sense that the value vastly outweighs the perceived cost or effort.

A marketing audit scrutinizes the offer. We look at the Value Ladder. Do you have an entry-point offer? Is there a logical upsell? Are you maximizing the Average Order Value (AOV)? If your AOV is too low, you’ll never be able to afford the rising costs of traffic.

Pillar 4: Creative Resonance

Creative is the new targeting. Since the algorithms are now better at finding your audience than you are, your “creative” (images, videos, headlines) does the heavy lifting. An audit looks at your historical creative performance. Which angles worked? Which ones flopped? We look for patterns in the “stop-rate” (the first 3 seconds of a video) and the “hold-rate” (how many people watched the whole thing).

>The Financial Impact: CAC vs. LTV

This is where the rubber meets the road. The ultimate goal of a marketing audit is to protect your Unit Economics. Reactive marketing often leads to a “Death Spiral” where the Cost Per Acquisition (CAC) exceeds the Lifetime Value (LTV) of a customer.

By conducting an audit first, you can identify ways to increase LTV through email marketing, SMS, and retention strategies before you pump the top of the funnel. If you can increase your LTV by 20% through a simple automated email sequence, you can suddenly afford to spend more on ads than your competitors. That is how you win markets.

“The business that can afford to spend the most to acquire a customer wins.” – Dan Kennedy

But you can only afford to spend the most if your backend is optimized. A diagnostic audit ensures that your backend is a profit-generating machine, not a black hole.

>Case Study: The $50,000 Lesson

I once consulted for an e-commerce brand spending $50,000 a month on Google Ads. They were barely breaking even and were convinced they needed a “better Google Ads expert.”

We paused the spend and did a 14-day diagnostic audit. We found two glaring issues:

  • The Mobile Checkout: The “Add to Cart” button was hidden below the fold on 80% of mobile devices.
  • The Message Gap: Their ads promised “Next Day Shipping,” but their product pages said “Ships in 3-5 business days.”

We fixed the button and aligned the shipping message. We didn’t change a single thing in the Google Ads account. Within 30 days, their conversion rate jumped by 40%. They were suddenly profitable without spending an extra dime on traffic. That is the power of a diagnostic mindset.

>How to Conduct Your Own Preliminary Audit

While a professional audit is irreplaceable, you can start the diagnostic process yourself. Follow this checklist before you approve your next ad budget increase:

Step 1: The “Ghost” Test

Open an incognito window and try to buy your own product or book your own service on a mobile device using a slow Wi-Fi connection. Every time you feel a moment of frustration or confusion, write it down. That is a conversion killer.

Step 2: The “So What?” Test

Read your ad copy and your landing page headlines out loud. After every sentence, ask yourself, “So what?” If your copy says “We have a patented technology,” and the answer is “So what?”, you haven’t explained the benefit. Keep digging until the “So what?” is answered with “This will save me time/money/stress.”

Step 3: The Data Reconciliation

Compare your Shopify/CRM sales to your Ad Manager sales. If there is a discrepancy of more than 20%, your tracking is broken. Do not scale until you know where your money is coming from.

>Stop Reacting. Start Diagnosing.

Ad spend is a multiplier. It multiplies what you already have. If you have a high-converting, psychologically resonant, technically sound sales process, ads will multiply your wealth. If you have a confusing, slow, “me-centric” website, ads will only multiply your losses.

The next time you feel the urge to “just try some ads,” stop. Take a breath. Invest in a marketing audit. It is the only way to ensure that your marketing budget is an investment in growth rather than a donation to Silicon Valley’s bottom line.

Marketing is a science of certainty, not a game of chance. You wouldn’t accept a medical diagnosis without a check-up; don’t accept a marketing strategy without an audit. Your balance sheet will thank you.

>Final Thoughts for the Decision Maker

If you are a CEO, a Founder, or a Marketing Director, your job is to be a steward of the company’s resources. Reactive spending is a failure of stewardship. A diagnostic audit is an act of leadership. It sets the tone for a culture of data-driven decisions and excellence. It forces your team to look at the hard truths and fix the foundational issues that are holding you back.

Are you ready to stop guessing and start growing? The audit is the first step. It’s time to look under the hood before you hit the gas.

Beyond the “Hustle”: Why Empirical Evidence is the Only Foundation for Sustainable Growth.

The business world has a fetish for the “grind.” If you spend ten minutes on LinkedIn or Twitter, you are bombarded with the same tired tropes: wake up at 4:00 AM, outwork your competition, “embrace the suck,” and wear your burnout like a badge of honor. We have romanticized the “hustle” to the point where we value movement over direction and effort over outcome. But here is the cold, hard truth that most gurus won’t tell you: the hustle is a lottery ticket, not a strategy.

I have spent years in the trenches of growth marketing and organizational design. I have seen founders work themselves into a hospital bed only to watch their companies fold in eighteen months. I have also seen “lazy” founders build empires by doing about four hours of high-leverage work a day. The difference isn’t grit. It isn’t even “passion.” The difference is the adherence to empirical evidence. If you are building a business based on gut feelings, caffeine, and motivational quotes, you aren’t an entrepreneur; you are a gambler who is running out of chips.

Visual for Beyond the

The Fatal Flaw of the Hustle Culture

The problem with hustle culture is that it confuses activity with achievement. In the early stages of a startup, yes, effort is required. But effort without an empirical feedback loop is just noise. When we operate in “hustle mode,” we are often operating in a state of high cortisol and low cognitive flexibility. We make decisions based on what feels productive rather than what the data proves is effective.

Hustle culture relies heavily on survivorship bias. We look at the one billionaire who slept on his office floor and assume that the floor-sleeping was the cause of his success. We ignore the 10,000 others who slept on their office floors and ended up bankrupt. Empirical evidence demands that we look at the denominator, not just the numerator. It forces us to ask: What are the repeatable, predictable variables that lead to growth?

The Psychological Cost of Ignoring Evidence

When you ignore evidence in favor of raw effort, you eventually hit a wall called Decision Fatigue. Your brain can only make a finite number of high-quality decisions per day. If you are “hustling” through 16-hour days, by hour ten, your ability to discern a good lead from a bad one or a sound investment from a sinkhole is compromised. Evidence-based growth acts as a cognitive externalization; the data makes the hard choices for you, preserving your mental energy for execution.

Visual for Beyond the

Defining Empirical Growth: Beyond the Buzzwords

To move beyond the hustle, we must first define what we mean by empirical evidence. In a business context, this is the application of the scientific method to your growth strategy. It is the transition from “I think our customers like X” to “We have observed a 22% higher conversion rate when we present X instead of Y, with a 95% confidence interval.”

Empirical growth is built on three pillars:

  • Observable Data: Real-world interactions, not hypothetical market research or “expert” opinions.
  • Falsifiability: Every strategy you deploy must be capable of being proven wrong. If you cannot define what failure looks like, you cannot recognize success.
  • Reproducibility: If you can’t make the growth happen twice using the same variables, you haven’t found a strategy; you’ve found a fluke.

The Difference Between Vanity Metrics and Empirical Signals

One of the biggest mistakes “hustlers” make is chasing vanity metrics. These are numbers that look great on a slide deck but have zero correlation with sustainable revenue. High social media engagement, “raw” website traffic, and the number of employees you have are classic vanity metrics. They feed the ego, but they don’t feed the bottom line.

Empirical signals, on the other hand, focus on unit economics and retention. If your Customer Acquisition Cost (CAC) is higher than your Lifetime Value (LTV), no amount of “hustle” will save you. In fact, the harder you hustle in that scenario, the faster you will go broke. Empirical evidence forces you to stop and fix the leaky bucket before you try to pour more water into it.

Visual for Beyond the

The Survivorship Bias Trap: Why Your Heroes Are Lying to You

Every biography of a successful tech mogul follows the same narrative arc: they had a “vision,” they worked harder than everyone else, they took massive risks, and they won. But if you dig into the actual mechanics of their growth, you find something different. You find that they were obsessively data-driven.


The “vision” is usually just a hypothesis. The “risk” was usually a calculated experiment where the downside was capped. The “hard work” was focused on optimizing systems, not just performing tasks. When we try to emulate the “hustle” without the “evidence,” we are essentially trying to fly a plane by flapping our arms really fast because we saw a bird do it. It’s the wrong mechanism for the desired outcome.

The Danger of “Founder Intuition”

Founder intuition is a dangerous drug. It feels like a superpower, but it’s often just a collection of personal biases disguised as insight. Intuition is great for generating hypotheses, but it is a terrible tool for validating them. A sustainable growth model requires the humility to let the data tell you that your “brilliant” idea is actually a dud.

>Building the Infrastructure for Sustainable Growth

If you want to move away from the frantic energy of the hustle and toward the steady, compounding growth of an empirical system, you need the right infrastructure. This isn’t about buying expensive software; it’s about a shift in your operational philosophy.

1. The Feedback Loop: The Heartbeat of Growth

Every action your company takes should be part of a loop. You launch a campaign, you measure the result, you analyze the variance between your expectation and reality, and you iterate. Most “hustle” companies skip the analysis and iteration phases. They just launch, launch, launch. By the time they realize they are heading in the wrong direction, they are 50 miles off course.

2. Cohort Analysis: Seeing the Truth Behind the Averages

Averages lie. If you look at your average retention rate, you might think you’re doing fine. But if you perform a cohort analysis—breaking down users by the month they joined—you might find that your newest users are leaving at twice the rate of your early adopters. This is an empirical “fire alarm” that the hustle-mindset would miss while focusing on total user growth.

3. The North Star Metric

A sustainable business needs one single metric that represents the value delivered to the customer. For Airbnb, it’s nights booked. For Slack, it’s messages sent. If your North Star metric is growing, your business is likely healthy. If you are “hustling” but your North Star metric is flat, you are wasting your life. Empirical evidence keeps you focused on the one thing that actually matters.

The “20-Mile March”: Why Pacing Beats Sprinting

In his book Great by Choice, Jim Collins introduces the concept of the “20-Mile March.” He tells the story of two explorers racing to the South Pole. One explorer pushed his team to the limit on good weather days and hunker down on bad days. The other explorer committed to walking 20 miles every single day, regardless of the weather. The one who paced himself—the one who adhered to a strict, evidence-based regimen—was the one who survived and won.

Growth is a marathon, not a sprint. Hustle culture is a series of frantic sprints that lead to exhaustion and injury. Sustainable growth is the 20-mile march. It requires the discipline to not overextend yourself when things are going well, so that you have the reserves to maintain your pace when things get difficult.

The Compounding Power of Small Gains

If you improve your conversion rate by just 1% every week, you don’t just grow by 52% in a year. Because of compounding, you actually grow by nearly 68%. This is the “boring” path to success. It doesn’t make for a great Instagram story, but it makes for a very large bank account. Hustle culture looks for 100% gains overnight; empirical growth looks for 1% gains that last forever.

>Case Study: The Pivot from Hype to Evidence

Consider the story of a well-known D2C mattress brand (we’ll keep it nameless to be polite). In their early years, they were the darlings of the “hustle” world. They raised hundreds of millions, spent aggressively on billboards and podcasts, and grew their top-line revenue at a staggering pace. They were “winning” the hustle game.

However, their unit economics were a disaster. They were losing money on every mattress sold once you factored in returns and marketing costs. They ignored the empirical evidence that their business model was unsustainable because they were addicted to the “growth at all costs” narrative. When the venture capital dried up, the hustle couldn’t save them. They had to drastically downsize and restructure. Meanwhile, smaller, quieter competitors who focused on profitable unit economics from day one are now the ones dominating the market.

>Step-by-Step: How to Transition to an Empirical Framework

If you’re currently caught in the hustle trap, how do you get out? You can’t just stop working, but you can change how you work. Follow this framework to transition your business into an evidence-led organization.

Step 1: The Data Audit

Sit down and list every metric you currently track. Now, go through that list and delete anything that you cannot directly link to revenue or customer retention. If a number goes up and you don’t know exactly what action caused it, it’s not data—it’s noise. You need to identify your levers.

Step 2: Establish Your Baselines

You cannot measure growth if you don’t know where you are starting. Establish firm baselines for your CAC, LTV, Churn Rate, and Conversion Rate. These are your “vital signs.” If any of these numbers move in the wrong direction, you stop the hustle and find out why. You don’t “grind” through a declining LTV.

Step 3: Run Weekly Sprints (The Real Kind)

In Agile methodology, a “sprint” isn’t about working harder; it’s about time-boxing an experiment. Every week, pick one variable to test. Maybe it’s a headline on a landing page, or a different lead magnet, or a pricing tweak. At the end of the week, look at the evidence. Did it work? If yes, keep it. If no, discard it. This is how you build a “Growth Machine.”

Step 4: Institutionalize the Learning

The greatest asset of an empirical company isn’t its product; it’s its knowledge base. Every time an experiment fails, document it. Why did it fail? What did we learn about our customers? This ensures that you never make the same mistake twice. In a hustle-based company, mistakes are repeated constantly because everyone is too busy to document the “why.”

>The Myth of “Not Enough Time”

The most common pushback I hear from founders is: “I don’t have time for all this data stuff. I just need to get things done!”

This is the ultimate irony. You have time to work 80 hours a week on things that might not work, but you don’t have three hours a week to ensure that your work is actually effective? The “not enough time” excuse is a psychological defense mechanism. Analyzing data is hard. It forces us to confront the possibility that we are wrong. Hustling is easy. It allows us to feel productive even when we are failing.

Sustainable growth requires the courage to be slow. It requires the maturity to admit that your effort is not a substitute for a viable strategy. If you don’t have time for evidence, you are effectively saying you have time for failure.

>The Biological Imperative of Sustainability

We often talk about business sustainability in terms of finances, but what about human sustainability? Your brain is a biological organ. It requires glucose, rest, and low-stress environments to function at peak capacity. When you operate in a state of perpetual hustle, you are essentially “overclocking” your brain. Eventually, the hardware fries.

Empirical evidence provides the “guardrails” for your mental health. When you know that your systems are working—because the data tells you so—your baseline stress level drops. You no longer feel the need to check your email at 2:00 AM because you trust the feedback loops you’ve built. This isn’t just better for your business; it’s better for your life. You can’t enjoy the fruits of your labor if you’ve burned out your capacity for joy before you reach the finish line.

>Conclusion: The New Standard of Excellence

The era of the “uninformed hustle” is coming to an end. In an age of AI-driven optimization and hyper-competitive global markets, raw effort is no longer a competitive advantage. Anyone can work hard. Anyone can pull an all-nighter. The new “moat”—the thing that will separate the titans from the also-rans—is the ability to process information and pivot based on empirical evidence faster than anyone else.

Stop looking at the clock and start looking at the spreadsheet. Stop valuing the “grind” and start valuing the truth. Growth is not a result of how much you suffer; it is a result of how much you learn. If you want to build something that lasts—something that grows while you sleep and sustains you for decades—you must move beyond the hustle. You must build your foundation on the only thing that doesn’t lie: evidence.

Are you ready to stop guessing and start growing?